
Yi Wei, Chen Hui, Wu Ying, Chen Yong. Effect of in situ NbC on Microstructure and Wear Properties of Laser Cladding Co-Based Coatings[J]. Chinese Journal of Lasers, 2020, 47(3): 302010
- Chinese Journal of Lasers
- Vol. 47, Issue 3, 302010 (2020)
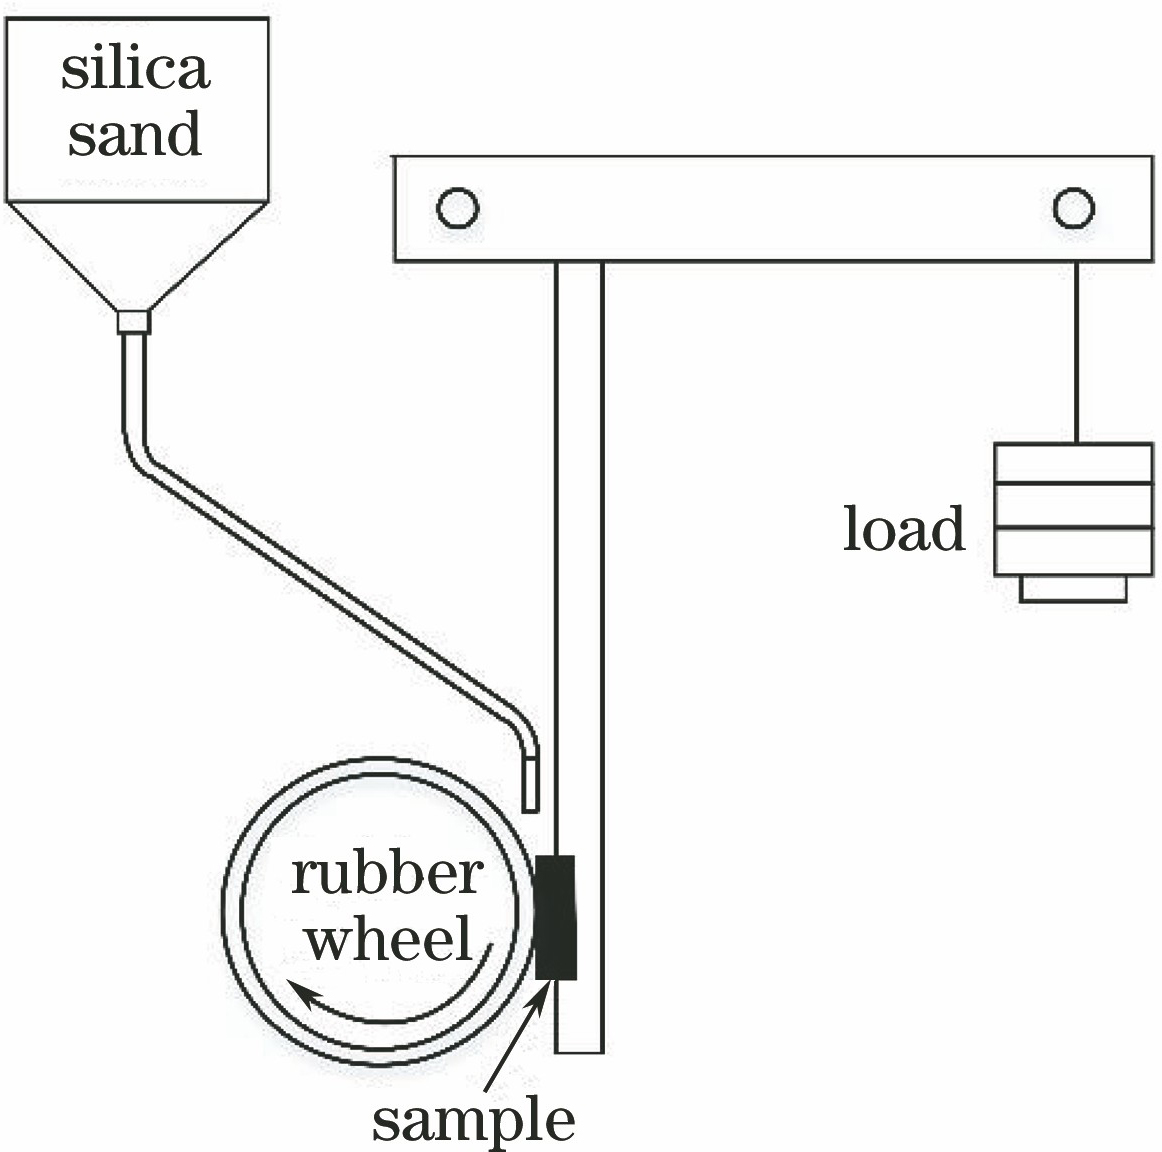
Fig. 1. Diagram of friction wear test
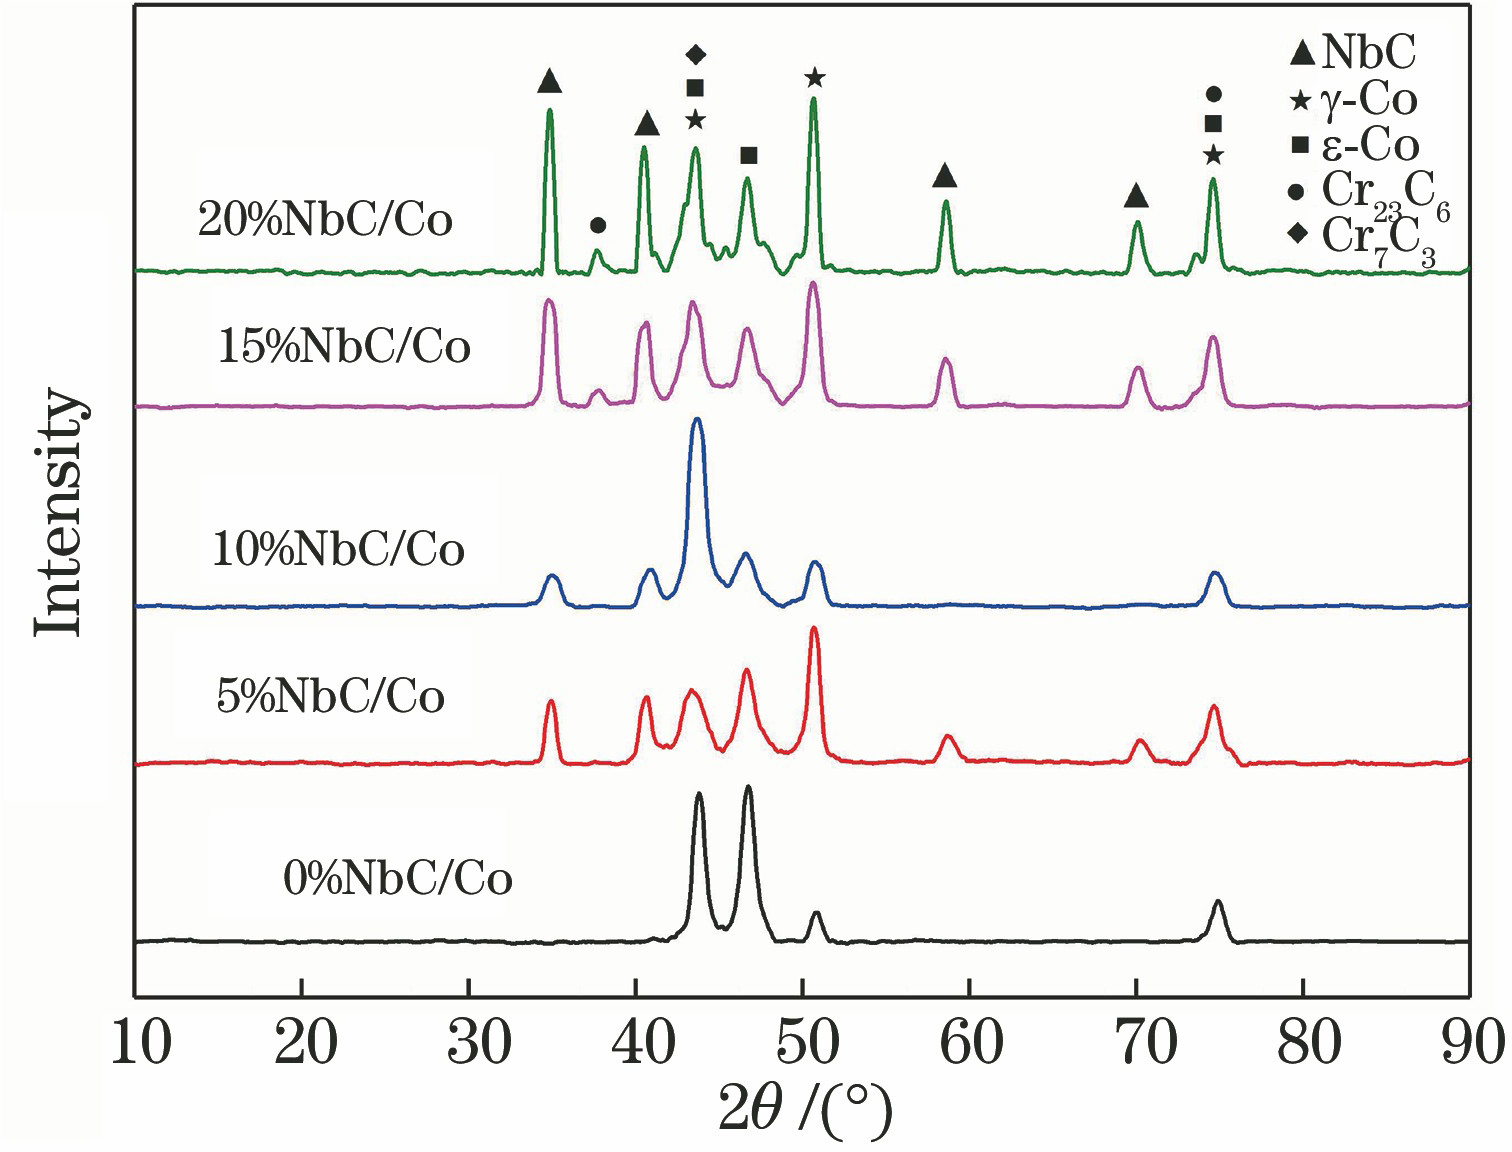
Fig. 2. XRD patterns of different NbC/Co coatings
Fig. 3. Gibbs free energy for possible reactions
Fig. 4. Test area of EDS
Fig. 5. Macro-morphologies of composite coatings. (a) Single channel morphology; (b) cross-section morphology of 1# coating; (c) multiple channel morphology
Fig. 6. SEM images of different NbC/Co coatings. (a) 0%NbC/Co; (b) 5%NbC/Co; (c) 10%NbC/Co; (d) 15%NbC/Co; (e) 20%NbC/Co
Fig. 7. Average hardness of different composite coatings
Fig. 8. Wear rate of different composite coatings
Fig. 9. Worn morphologies of different composite coatings. (a)(b) 0%NbC/Co; (c) 5%NbC/Co; (d) 10%NbC/Co;(e) 15%NbC/Co; (f) local magnification of 15%NbC/Co
|
Table 1. Chemical composition of 42CrMo steel%
|
Table 2. Chemical composition of Co-based powder%
|
Table 3. Mass fraction of each composition of mixed powder%
|
Table 4. Experimental parameters of laser cladding
|
Table 5. Experimental parameters of friction wear test
| ||||||||||||||||||||||||||||||||||||||||||||||||||||||||||||||
Table 6. Chemical compositions of phases in Fig. 4

Set citation alerts for the article
Please enter your email address
© Copyright 2018-2021 | Chinese Laser Press. All Rights Reserved 沪ICP备15018463号-20