• Photonics Research
  • Vol. 8, Issue 5, 698 (2020)
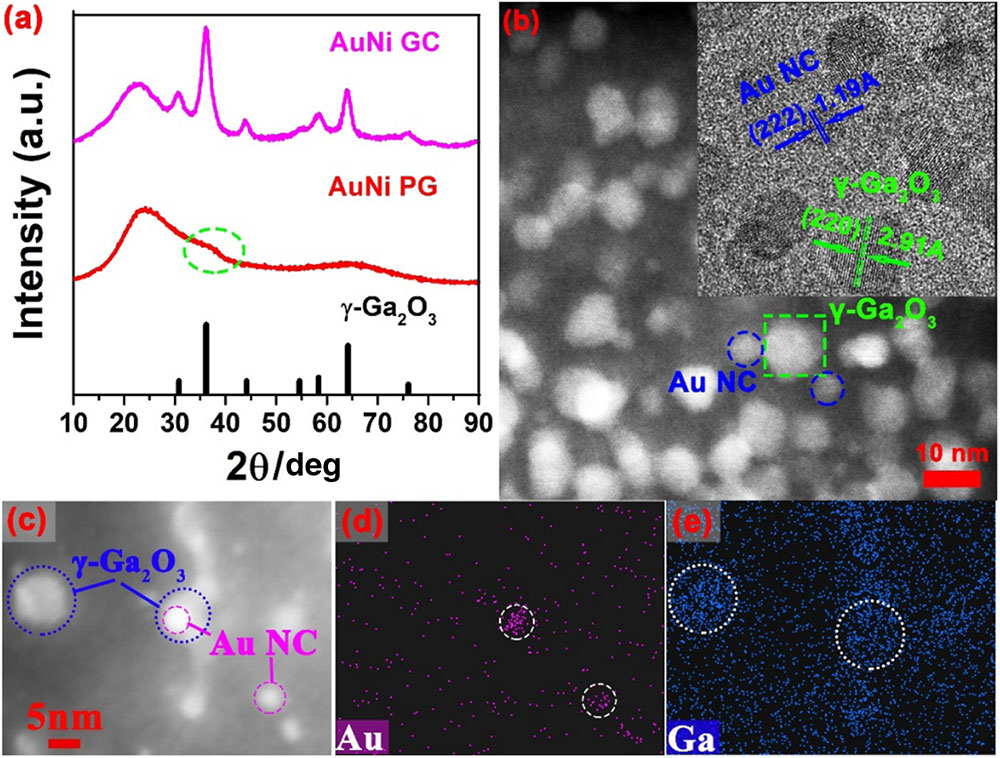
Zhigang Gao1、2, Haibo Zhu1, Bochao Sun1, Yingke Ji1, Xiaosong Lu1, Hao Tian1, Jing Ren1、6、*, Shu Guo3, Jianzhong Zhang1、7、*, Jun Yang1、4、8、*, Xiangeng Meng5, and Katsuhisa Tanaka2
Author Affiliations
  • 1Key Laboratory of In-fiber Integrated Optics, Ministry of Education, Harbin Engineering University, Harbin 150001, China
  • 2Department of Material Chemistry, Graduate School of Engineering, Kyoto University, Nishikyo-ku, Kyoto 615-8510, Japan
  • 3Center of Analysis and Measurement, Harbin Institute of Technology, Harbin 150001, China
  • 4School of Information Engineering, Guangdong University of Technology, Guangzhou 510008, China
  • 5Key Laboratory of Processing and Testing Technology of Glass & Functional Ceramics of Shandong Province, School of Materials Science & Engineering, Qilu University of Technology (Shandong Academy of Sciences), Jinan 250353, China
  • 6e-mail: ren.jing@hrbeu.edu.cn
  • 7e-mail: zhangjianzhong@hrbeu.edu.cn
  • 8e-mail: yangj@gdut.edu.cn
  • show less
    DOI: 10.1364/PRJ.379662 Cite this Article Set citation alerts
    Zhigang Gao, Haibo Zhu, Bochao Sun, Yingke Ji, Xiaosong Lu, Hao Tian, Jing Ren, Shu Guo, Jianzhong Zhang, Jun Yang, Xiangeng Meng, Katsuhisa Tanaka. Photonic engineering of superbroadband near-infrared emission in nanoglass composites containing hybrid metal and dielectric nanocrystals[J]. Photonics Research, 2020, 8(5): 698 Copy Citation Text show less
    (a) XRD patterns of the 0.15Ni2+/0.5Au-codoped PG and GC samples. The pattern of the reference γ-Ga2O3 crystal (PDF# 20-0426) is also presented at the bottom. (b) A dark-field TEM image of the GC sample. The inset shows the corresponding HRTEM image, where the blue circles and green squares indicate the presence of Au and Ga2O3 NCs, respectively. (c) HAADF-STEM image of the GC sample, and the corresponding STEM-EDS maps for the (d) Au and (e) Ga elements.
    Fig. 1. (a) XRD patterns of the 0.15Ni2+/0.5Au-codoped PG and GC samples. The pattern of the reference γ-Ga2O3 crystal (PDF# 20-0426) is also presented at the bottom. (b) A dark-field TEM image of the GC sample. The inset shows the corresponding HRTEM image, where the blue circles and green squares indicate the presence of Au and Ga2O3 NCs, respectively. (c) HAADF-STEM image of the GC sample, and the corresponding STEM-EDS maps for the (d) Au and (e) Ga elements.
    Transmission spectra of the 0.15Ni2+ singly-doped and 0.15Ni2+/0.5Au-codoped PG and GC samples (thickness, 1.2 mm). The inset shows the digital photographs of the samples.
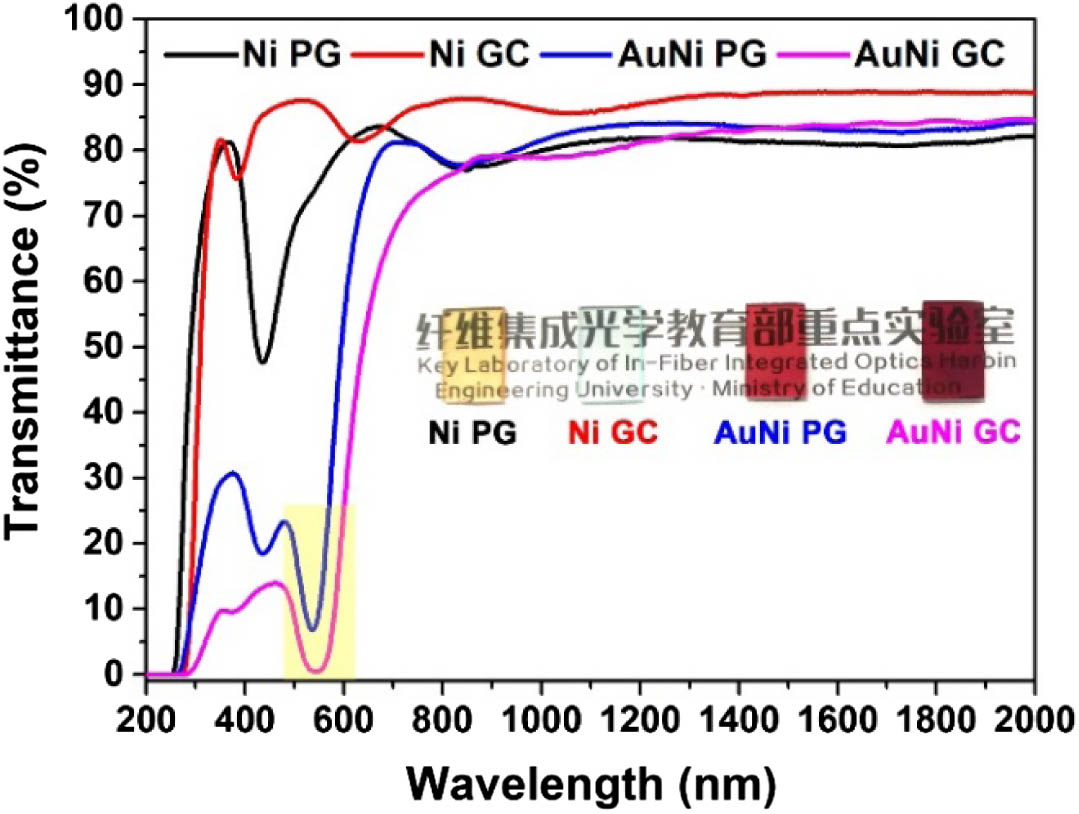
    Fig. 2. Transmission spectra of the 0.15Ni2+ singly-doped and 0.15Ni2+/0.5Au-codoped PG and GC samples (thickness, 1.2 mm). The inset shows the digital photographs of the samples.
    Emission spectra of the samples doped with 0 mol.% Au (Ni GC), 0.3 mol.% Au (0.3AuNi GC), 0.5 mol.% Au (0.5AuNi GC), and 0.7 mol.% Au (0.7AuNi GC) excited at (a) 980 nm and (b) 532 nm, respectively; PL decay curves of the Ni2+ 1300 nm emission of the samples excited at (c) 980 nm and (d) 532 nm, respectively.
    Fig. 3. Emission spectra of the samples doped with 0 mol.% Au (Ni GC), 0.3 mol.% Au (0.3AuNi GC), 0.5 mol.% Au (0.5AuNi GC), and 0.7 mol.% Au (0.7AuNi GC) excited at (a) 980 nm and (b) 532 nm, respectively; PL decay curves of the Ni2+ 1300 nm emission of the samples excited at (c) 980 nm and (d) 532 nm, respectively.
    (a) Simulation model as referred to the TEM image shown in (b); (b) normalized local electric field (Eloc) distribution with respect to the incident 980 nm pump light (E0) in the single-phase Ga2O3 (lower right and left) and dual-phase Ga2O3 and Au GCs (upper right); normalized integrated local electric field (∫|Eloc|dS) at the upper surface of the Ga2O3 NCs as a function of (c) the distance, d, between Au and Ga2O3 NCs and (d) the radius, r, of Au NCs with a fixed distance.
    Fig. 4. (a) Simulation model as referred to the TEM image shown in (b); (b) normalized local electric field (Eloc) distribution with respect to the incident 980 nm pump light (E0) in the single-phase Ga2O3 (lower right and left) and dual-phase Ga2O3 and Au GCs (upper right); normalized integrated local electric field (|Eloc|dS) at the upper surface of the Ga2O3 NCs as a function of (c) the distance, d, between Au and Ga2O3 NCs and (d) the radius, r, of Au NCs with a fixed distance.
    (a) Emission spectra of the 0.15 mol.% Ni2+-doped single- (Ni GC) and dual-phase (AuNi GC) GC samples, 1.0 mol.% Yb3+/0.15 mol.% Ni2+-codoped single- (YbNi GC) and dual-phase (AuYbNi GC) GC samples excited at 980 nm; (b) scheme of the two-wave mixing method. ISO, isolator; Coupler, at the 980 and 1310 nm wavelengths; Filter, filtering out the 980 nm light; DSO, digital storage oscilloscope; (c) optical amplification properties at 1310 nm of the dual-phase GCs codoped with (in the middle) and without Yb3+/Ni2+ (Yb/Ni-free, on the left), and of the single-phase GC codoped with Yb3+/Ni2+ (Au NC-free, on the right) for comparison.
    Fig. 5. (a) Emission spectra of the 0.15  mol.%  Ni2+-doped single- (Ni GC) and dual-phase (AuNi GC) GC samples, 1.0  mol.%Yb3+/0.15  mol.%Ni2+-codoped single- (YbNi GC) and dual-phase (AuYbNi GC) GC samples excited at 980 nm; (b) scheme of the two-wave mixing method. ISO, isolator; Coupler, at the 980 and 1310 nm wavelengths; Filter, filtering out the 980 nm light; DSO, digital storage oscilloscope; (c) optical amplification properties at 1310 nm of the dual-phase GCs codoped with (in the middle) and without Yb3+/Ni2+ (Yb/Ni-free, on the left), and of the single-phase GC codoped with Yb3+/Ni2+ (Au NC-free, on the right) for comparison.
    Transmission spectra of the rapidly quenched (air-quenched) and annealed glasses (PG) and the GC sample doped with 0.5 mol.% Au.
    Fig. 6. Transmission spectra of the rapidly quenched (air-quenched) and annealed glasses (PG) and the GC sample doped with 0.5 mol.% Au.
    (a) Simulation model based on the TEM image shown in Fig. 4(b), and (b) local electric field distribution of the light in the Au LSPR band at 532 nm.
    Fig. 7. (a) Simulation model based on the TEM image shown in Fig. 4(b), and (b) local electric field distribution of the light in the Au LSPR band at 532 nm.
    Emission spectra of the 1.0 mol.% Yb3+-doped (Yb PG) and 1.0 mol.% Yb3+/0.5 mol.% Au-doped (AuYb PG) PGs as well as the 1.0 mol.% Yb3+-doped single- (Yb GC) and dual-phase (AuYb GC) GC samples under 980 nm excitation.
    Fig. 8. Emission spectra of the 1.0  mol.%Yb3+-doped (Yb PG) and 1.0  mol.%Yb3+/0.5mol.%Au-doped (AuYb PG) PGs as well as the 1.0  mol.%Yb3+-doped single- (Yb GC) and dual-phase (AuYb GC) GC samples under 980 nm excitation.
    Emission spectra of the 0.2 mol.% Er3+-doped (Er PG) and 0.2 mol.% Er3+/0.5 mol.% Au-doped (AuEr PG) PGs as well as the 0.2 mol.% Er3+-doped single- (Er GC) and dual-phase (AuEr GC) GC samples under 980 nm excitation.
    Fig. 9. Emission spectra of the 0.2  mol.%Er3+-doped (Er PG) and 0.2 mol.% Er3+/0.5 mol.% Au-doped (AuEr PG) PGs as well as the 0.2  mol.%Er3+-doped single- (Er GC) and dual-phase (AuEr GC) GC samples under 980 nm excitation.
    UCL spectra of the 1.0 mol.% Yb3+/0.2 mol.% Er3+-doped (YbEr PG) and 1.0 mol.% Yb3+/0.2 mol.% Er3+/0.5 mol.%Au-doped (AuYbEr PG) PGs as well as the 1.0 mol.% Yb3+/0.2 mol.%Er3+-doped single- (YbEr GC) and dual-phase (AuYbEr GC) GC samples under 980 nm excitation.
    Fig. 10. UCL spectra of the 1.0  mol.%Yb3+/0.2  mol.%Er3+-doped (YbEr PG) and 1.0  mol.%Yb3+/0.2  mol.%Er3+/0.5mol.%Au-doped (AuYbEr PG) PGs as well as the 1.0  mol.%Yb3+/0.2  mol.%Er3+-doped single- (YbEr GC) and dual-phase (AuYbEr GC) GC samples under 980 nm excitation.
    Emission spectra of the 0.2 mol.% Eu3+-doped (Eu PG) and 0.2 mol.% Eu3+/0.5 mol.%Au-doped (AuEu PG) PGs as well as the 0.2 mol.% Eu3+-doped single- (Eu GC) and dual-phase (AuEu GC) GC samples under 532 nm excitation.
    Fig. 11. Emission spectra of the 0.2  mol.%Eu3+-doped (Eu PG) and 0.2  mol.%Eu3+/0.5mol.%Au-doped (AuEu PG) PGs as well as the 0.2  mol.%Eu3+-doped single- (Eu GC) and dual-phase (AuEu GC) GC samples under 532 nm excitation.
    Zhigang Gao, Haibo Zhu, Bochao Sun, Yingke Ji, Xiaosong Lu, Hao Tian, Jing Ren, Shu Guo, Jianzhong Zhang, Jun Yang, Xiangeng Meng, Katsuhisa Tanaka. Photonic engineering of superbroadband near-infrared emission in nanoglass composites containing hybrid metal and dielectric nanocrystals[J]. Photonics Research, 2020, 8(5): 698
    Download Citation