In this paper, two improved network models, SVM (Linear)-based VGG19 and XGBoost-based VGG19, are constructed by combining the VGG19 convolutional neural network with two machine learning algorithms. Moreover, the VGG19 model and the two improved models are employed to classify bacterial pneumonia and viral pneumonia images. Additionally, the performances of the three models are evaluated and compared, the results show that the average accuracies of the three models are all above 85.9%. The improved VGG19 models show superior stability in accuracy over conventional VGG19 model, and the comprehensive performance of XGBoost-based VGG19 model is best, which verifies the effectiveness of deep learning models combined with machine learning models.
Pneumonia is an infection of the lungs that can cause mild to severe illness in people of all ages,and it is a disease with high morbidity and mortality among children and the elderly worldwide. The number of deaths due to influenza and pneumonia in the United States was close to 50 000 in 2019,ranking ninth among the ten leading causes of death in the United States[1]. With the increasing threat of pneumonia to people,the diagnosis and treatment of pneumonia have attracted more attention.
Lung X-ray is the most commonly used examination method for pneumonia. However,the presence of the conditions such as pulmonary edema,pulmonary hemorrhage,atelectasis,or collapse of the lungs makes the overall diagnostic process of pneumonia very difficult. According to reports,there is considerable subjective inconsistency in the radiologist's decision when diagnosing pneumonia. Especially in the countries or areas where medical technology is not very developed,there is a lack of well-trained radiologists,which probably cause misdiagnosis or missed diagnosis. Therefore,a Computer-Aided Diagnosis(CAD)system is particularly needed,which can help radiologists quickly and accurately distinguish different lung diseases among the lung X-ray images.
Deep Learning(DL)is an emerging tool in the healthcare sector for medical diagnostics. The rise of deep learning algorithms,such as Convolutional Neural Networks(CNNs),offers fascinating perspectives for the automation of medical image analysis. DL techniques have been used to classify,segment and automatic localize for many medical images such as X-ray,Computed Tomography(CT),fundus images,mammography,Magnetic Resonance Imaging(MRI),and Electrocardiogram(ECG),etc[2]. Different CNNs,such as VGG,ResNet and Inception,are employed to apply widely in the recognition of pneumonia images[3-9],and many outstanding results have been achieved. For example,HASHMI M F et al.[6] proposed a weighted classifier-based pneumonia detection model. Their experimental results were derived from the weighted predictions of several different deep learning models. The proposed weighted classifier outperformed all individual models for the rapid diagnosis of pneumonia. And the accuracy of 98.43% and the AUC score of 99.76% were achieved on the experimental pneumonia dataset. CHOUHAN V et al.[7] proposed a novel transfer learning based deep learning framework for pneumonia detection. The approach used five different network models pretrained on ImageNet to extract features from images and then fed these features into a classifier for prediction. The ensemble model achieved an accuracy of 96.4% and a recall rate of 99.62% on the pneumonia dataset. MISRAS et al.[8] proposed a multichannel pretrained ResNet network model for the diagnosis of COVID-19 chest X-ray. Three ResNet-based models were retrained,ensembled and fine-tuned using X-ray images of 1 579 normal patients,4 245 pneumonia patients,and 184 COVID-19 patients and provided a precision of 94% and a recall of 100%. In our previous work,we investigated pneumonia image classification using the VGG16,VGG19,and InceptionV3 models[9]. The results showed that the accuracies of the three models were all above 92%,and the performances of VGG19 and InceptionV3 are comparable but better than VGG16.
In this paper,by combining a Visual Geometry Group with 19 layers(VGG19)CNN with machine learning algorithms,two improved models,Support Vector Machine(SVM)(Linear)-based VGG19 and eXtreme Gradient Boosting(XGBoost)-based VGG19,are constructed. Moreover,VGG19 and the two improved models are employed to classify bacterial pneumonia and viral pneumonia images. Additionally,the performances of the three models are evaluated and compared.
Dataset and image preprocessing
X-ray image dataset
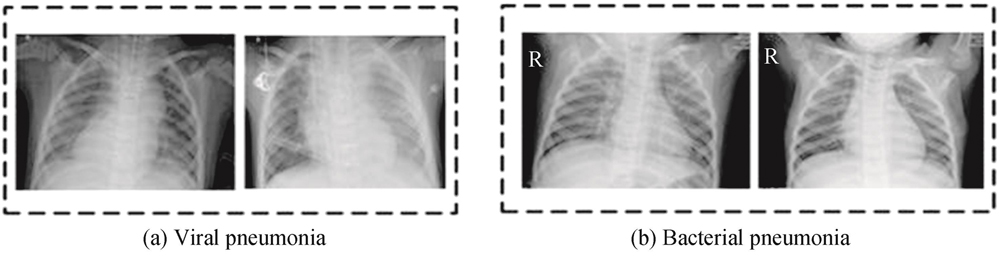
The lung X-ray image dataset used in the experiment comes from Kaggle,which includes 1 345 viral pneumonia images and 2 530 bacterial pneumonia images. Fig. 1 shows the examples of lung X-ray images of viral pneumonia and bacterial pneumonia,which are labeled as “Virus” and “Bacteria”,respectively. The samples are divided randomly into a training set and a validation set according to the ratio of 8∶2 in the experiment.
The image preprocessing is an essential activity before training the model. As shown in Fig. 2,scaling transformation is the first step in the preprocessing and a bilinear interpolation algorithm is used to scale the images,adjusting the overall size of the images but retaining their main features. Then,linear transformation is used to enhance the sensitivity of the deep learning model to the position and direction of the X-ray images. Finally,contrast enhancement is performed on the processed images to improve the model's ability to recognize pneumonia images.
In order to meet the requirements of the deep learning model for the resolution of the input images,the X-ray image size needs to be adjusted before inputting into the deep learning model. Appropriately reducing the size of the image can reduce the data that need to be processed,which can effectively accelerate the iterative learning rate of the algorithm. Moreover,the decrease in the number of parameters can also suppress the over-fitting phenomenon during the training period to a certain extent. In the experiment,the bilinear interpolation algorithm[10] is used to process the original image,and its basic principle is shown in Fig. 3.
Figure 3.Basic principle of bilinear interpolation
The points and are the result values after linear interpolation and the calculation formula can be represented as
where is the pixel value of the point to be calculated, and represent the weights of and respectively. From this formula,we can determine the values of and . In the same way,the point can also be determined by performing the linear interpolation again. The specific formula is as follows.
where and represent the weights of and respectively.
Different deep learning models have specific requirements for the size of the input image. Here,the network we used requires an image input size of 224×224,so the size of all the images should be adjusted to 224×224 before inputting into the models. Fig. 4 shows an X-ray image before and after size adjustment.
Figure 4.The size of the original X-ray image is adjusted to 224×224
The linear transformation[11] of the image usually includes the enlargement,reduction,translation,and rotation operations. In order to preserve the information contained in the original images as much as possible,the rotation and translation operations are performed on the data set in our experiment. After rotation and translation,the number of pneumonia images in the test set increases sharply;this can improve the model's tolerance to samples and make the model more robust.
The rotation operation refers to rotating the image by an arbitrary angle θ centered on a point,and it does not change the RGB values of the original image pixels. In the experiment,the coordinate origin is used as the center of the rotation operation. And the equation of coordinate transformation is as follows.
where represent the initial coordinates of a pixel in the original image,and are the output coordinates after rotation.
The translation operation refers to moving all the points on the image in the same direction,which can be expressed as
where represent the initial coordinates of a pixel of the original image, are the pixel coordinates after translation,and represent the distance moving along the abscissa and ordinate.
Additionally,to better achieve the enhancement effect of the data,the rotation operation is performed by setting a random seed. Similarly,the translation operation also adopts this random method. Fig. 5 shows the lung X-ray image after linear transformation(including rotation and translation).
Figure 5.Lung X-ray image before and after linear transformation
The image contrast enhancement algorithms[12] can realize the feature enhancement of the pneumonia focus area,improving the recognition ability of pneumonia images by the model. The Contrast-Limited Adaptive Histogram Equalization(CLAHE)algorithm can ensure the integrity of details while limiting the contrast.
The CLAHE algorithm uses a sliding window of size 2 to divide an image into several rectangular blocks. By calculating the gray histogram and mapping function m(i)for each rectangular block separately,the corresponding slope H can be obtained as shown in Eq.(5). Then the CLAHE algorithm trims the histogram according to the set Hmax. Finally,all the rectangular areas are stitched together to obtain a contrast-enhanced image.
Fig. 6 is the image contrast enhancement comparison before and after CLAHE algorithm processing. The left image is the lung X-ray image after linear transformation operation,and the right image is the lung X-ray image processed by the CLAHE algorithm. It’s clear that the lung X-ray image on the right has more distinct features.
Figure 6.Image contrast enhancement comparison before and after CLAHE processing
According to our experience by employing CNNs in the classification of pneumonia images,VGG19 and InceptionV3 show comparable performances while InceptionV3 is more difficultly trained due to its structural complexity. Moreover,machine learning algorithms have good classification stability on smaller scale datasets,which can effectively improve the accuracy of data classification and reduce the risk of overfitting. Therefore,we try to combine VGG19 with machine learning algorithms[13-15],SVM and XGBoost,to construct improved VGG19 models,for the classification of pneumonia images.
Support Vector Machine (SVM)
SVM[13] is a non-parametric supervised learning model,and it is based on the Vapnik-Chervonekis(VC)dimension theory of statistical learning and the principle of structural risk minimization. It seeks the best compromise between model complexity and learning ability based on limited sample information and shows many unique advantages in solving small-sample,nonlinear and high-dimensional pattern recognition.
For non-linear classification and regression,they utilize the kernel trick to map inputs to high-dimensional feature spaces. SVMs construct a hyper-plane or a set of hyper-planes in a high or infinite dimensional space,which can be used for classification,regression or other tasks. Intuitively,a good separation is achieved by the hyper-plane that has the largest distance to the nearest training data points of any class(so-called functional margin),since in general the larger the margin the lower the generalization error of the classifier.
eXtreme Gradient Boosting (XGBoost)
XGBoost[14] is a special boosted tree algorithm,to be precise,a gradient boosted decision tree. It can quickly solve many data science problems with excellent algorithm performance and can be used in classification and regression problems. The objective function during XGBoost training consists of two components,the gradient boosting algorithm loss and the model complexity. Furthermore,XGBoost uses Newton's method to solve for the extreme value of the loss function. As a result,XGBoost has powerful classification properties.
Improved VGG19 models
VGG[15] is one of the representative networks of CNN. It is further optimized based on the AlexNet model and is able to extract more abstract features when processing images. Due to the deepening of the network structure,the VGG19 model has a stronger learning ability when performing image feature extraction[16]. In the VGG19 network structure,the number of convolutional kernels starts from 64 in the first layer and gradually multiplies to 512,after which the number remains constant. Moreover,due to the extensive use of small-sized convolutional kernels,the VGG19 models generally require less iteration to converge during training,which in turn speeds up the training speed.
In our experiment,the VGG19 model is chosen as the basic model. To take full advantage of the powerful feature extraction capability of the VGG19 model,we keep the convolutional and pooling layers;but the softmax layer in the original VGG19 model is replaced with a machine learning algorithm classifier for better classification stability and accuracy,as shown in Fig. 7. In other words,after several convolution blocks,the extracted features no longer enter the softmax layer of VGG19;they are sent to the machine learning classifier instead. In this way,the VGG19 model is combined with traditional machine learning methods-SVM(linear)[17] and XGBoost[18],and we get two improved VGG19 models.
When using the VGG19 model to discriminate pneumonia images,the training process is same as other convolutional neural networks. The weights are constantly updated through the forward propagation and back propagation process. However,regarding the SVM(linear)-based VGG19 and XGBoost-based VGG19 models,the training and testing process needs to be divided into two parts. As depicted in Fig. 7,the softmax layer of the VGG19 model is replaced with a machine learning algorithm. Therefore,during the model training process,both the convolutional neural network and the machine learning algorithm need to be trained.
Fig. 8 shows the workflow of the improved VGG19 framework. In the model training stage,the lung X-ray images are firstly input into the pre-trained VGG19 model that is based on transfer learning. Then,the weights of the feature extraction layer are fine-tuned by forward and backward propagation and we get a fine-tuned VGG19 model with updated weights to extract pneumonia image features. Afterward,we remove the softmax layer from the trained model and keep feature extraction structures. Here,the softmax layer outputs the classification results in the form of probabilities,and the other layers in the model are feature extraction structures. Repeatedly input the lung X-ray images in the sample set into the trained model,the corresponding feature vector can be obtained. These feature vectors represent the characteristics of the pneumonia images. Finally,the obtained feature vectors are used to train the SVM and XGBoost models. Once the SVM and XGBoost models are trained,they can output classification results. In this way,the binding models are established. The test stage is similar to the training stage. Through the trained VGG19 model,the feature vector of the lung X-ray images in the test set can be acquired. Then the feature vectors are fed into the trained SVM and XGBoost models and the image classification results can be output after fitting.
All the models are tested with the test dataset after the completion of the training phase. Their performances are validated using the accuracy,sensitivity,specificity,precision,F1 score,and Area Under the Curve(AUC)score. These values depend on the True Positive(TP),False Negative(FN),True Negative(TN)and False Positive(FP)values,which can be calculated from the confusion matrices of the three models. The corresponding descriptions of the performance metrics are shown below[15].
AUC score:The AUC statistic is an empirical measure of classification performance based on the area under a Receiver Operating Characteristics(ROC)curve. The ROC curve is the plot of sensitivity(TP rate)against specificity(FP rate),and AUC represents the degree of separability.
Performance comparison
In our experiments,VGG19,SVM(linear)-based VGG19 and XGBoost-based VGG19 models are used to classify bacterial pneumonia and viral pneumonia images. Fig. 9 shows the accuracy of the three models changing with the number of test,which indicates that the improved VGG19 models show superior stability in accuracy over conventional VGG19 model. Table 1 shows the comparison of the average accuracy,lowest and highest accuracy,and accuracy variance of the three models. It can be seen that the average accuracies of the three models are all above 85.9% and the average accuracy of XGBoost-based VGG19 model reaches 88.2%;the accuracy variances of improved VGG19 models are smaller than that of standard VGG19 model and the accuracy variance of SVM(linear)-based VGG19 is minimal.
Figure 9.Model accuracy changing with the number of test
To better compare the performance of the three models,we select the three best models with highest accuracy for further evaluation. According to the confusion matrices,the sensitivity,precision,specificity,F1 score,AUC score of the three models are calculated,as shown in Fig. 10. From the results we can see that the XGBoost-based VGG19 model has the best test stability,which demonstrates that the model we constructed significantly improves the classification performance.
Figure 10.The performance evaluation of three best models with highest accuracy
In this paper,we propose two improved VGG19 models by the combination of VGG19 with SVM and XGBoost,respectively. The VGG19 and improved VGG19 models are applied to classify the viral and bacterial pneumonia images. Considering the accuracy curve,the volatility of the SVM(linear)-based VGG19 and XGBoost-based VGG19 models is smoother than that of the VGG19 model. It indicates that the accuracy of the two improved models is more stable. Moreover,the accuracy of the XGBoost-based VGG19 model is higher than the other two models. From the comprehensive evaluation metrics of accuracy,sensitivity,specificity,precision,F1 score,and AUC,it can be seen that the improved VGG19 models show superior stability in accuracy over the conventional VGG19 model,and the XGBoost-based VGG19 model outperforms the other two models in a comprehensive evaluation. Our experimental results demonstrate that the XGBoost-based VGG19 model exhibits good performance in distinguishing bacterial pneumonia from viral pneumonia,which will simplify the detection of lung disease for experts as well as for doctors. Furthermore,the improved XGBoost-based VGG19 network could also extend to other areas for application.