• Acta Physica Sinica
  • Vol. 68, Issue 19, 196402-1 (2019)
Kai-Li Wang, Chun-Xue Wu, Jun Ai*, and Zhan Su
DOI: 10.7498/aps.68.20190662 Cite this Article
Kai-Li Wang, Chun-Xue Wu, Jun Ai, Zhan Su. Complex network centrality method based on multi-order K-shell vector[J]. Acta Physica Sinica, 2019, 68(19): 196402-1 Copy Citation Text show less
A diagram of the K-shell.K-shell分解法的示意图
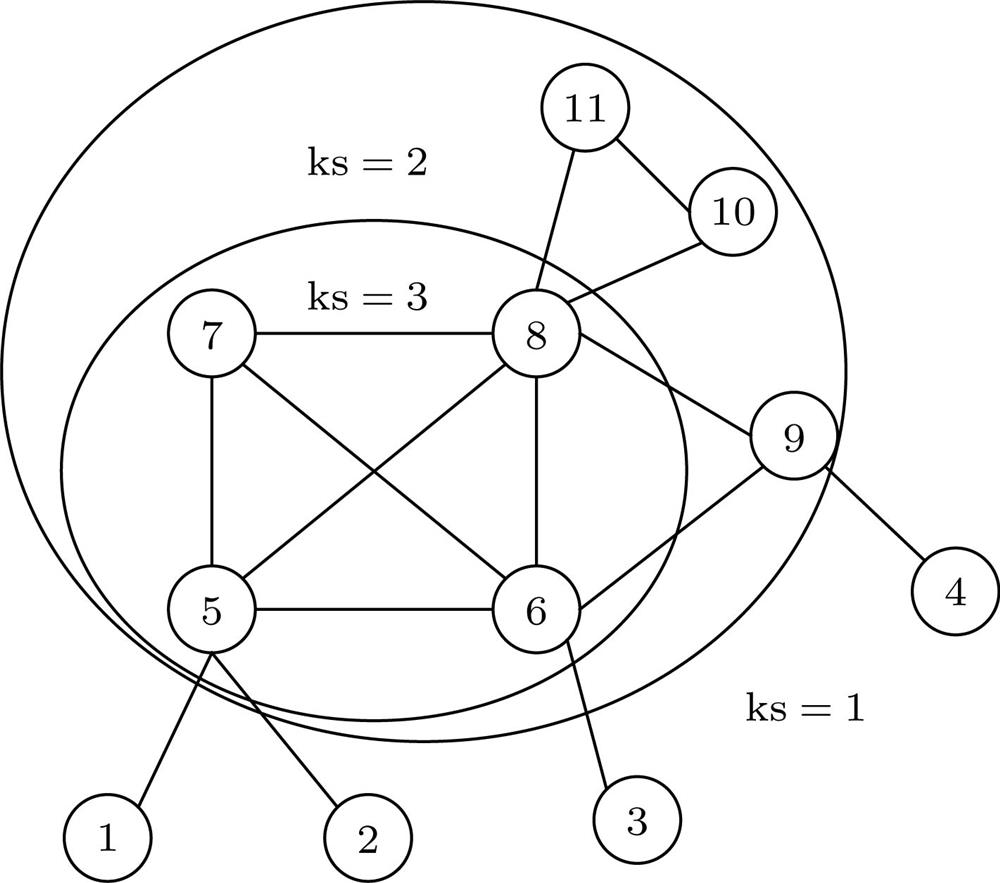
Fig. 1. A diagram of the K-shell.K-shell分解法的示意图
MKV algorithm implementation flow chart.MKV算法实现流程图
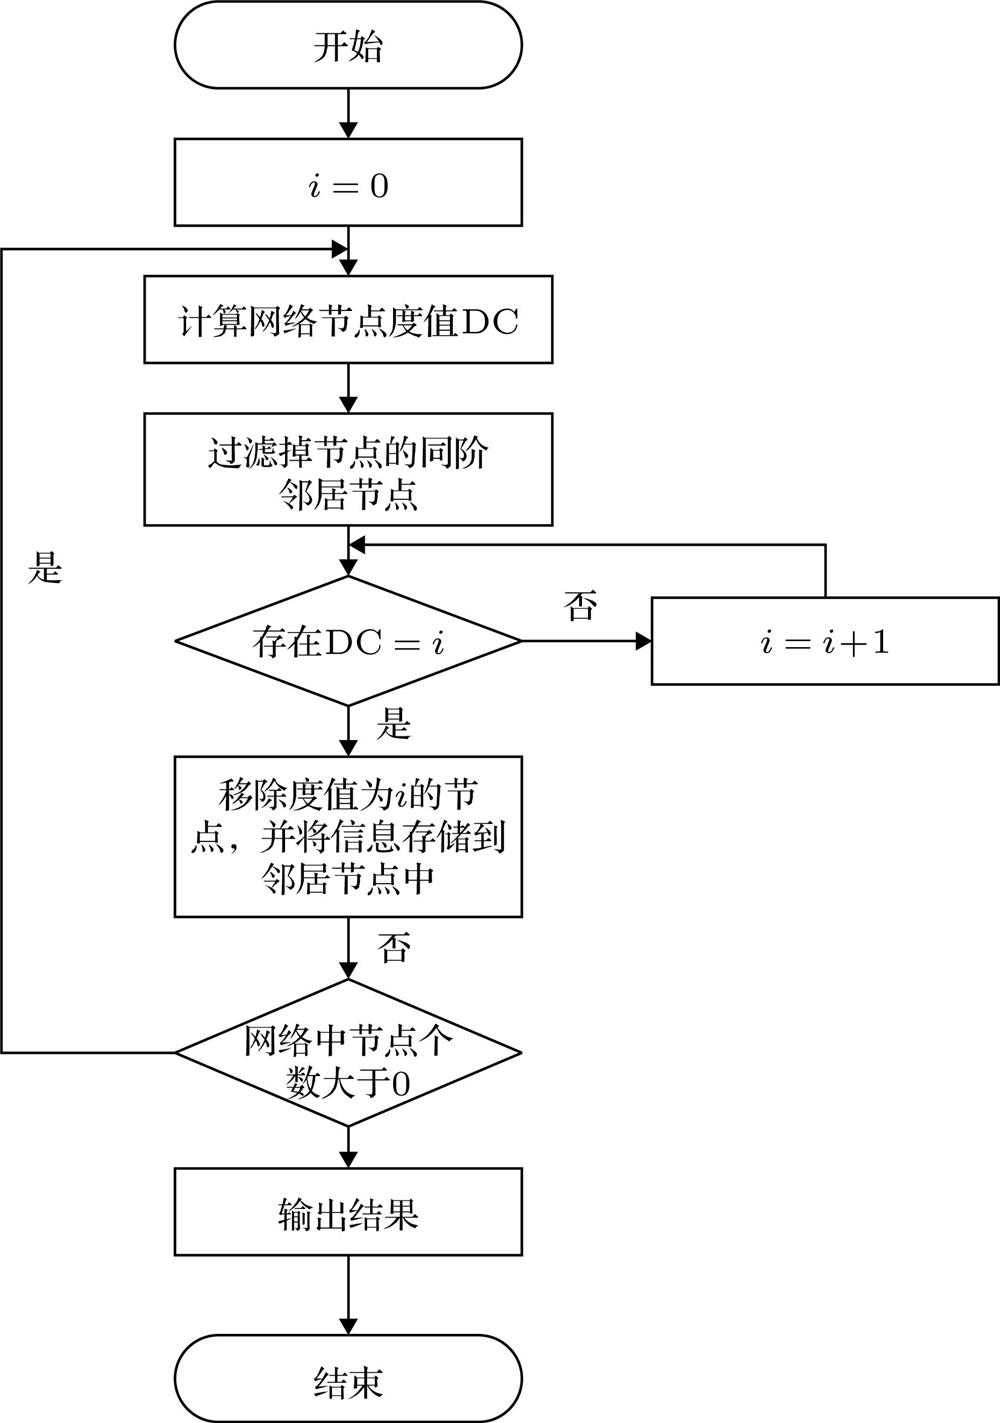
Fig. 2. MKV algorithm implementation flow chart.MKV算法实现流程图
Flow chart of vector comparison size algorithm.向量比较大小算法流程图
Fig. 3. Flow chart of vector comparison size algorithm.向量比较大小算法流程图
Largest connected component during static attack experiment on power.美国电力网power在静态攻击实验中最大连通子团变化情况
Fig. 4. Largest connected component during static attack experiment on power.美国电力网power在静态攻击实验中最大连通子团变化情况
Total component number during static attack experiment on power.美国电力网power在蓄意攻击实验中子团数量变化情况
Fig. 5. Total component number during static attack experiment on power.美国电力网power在蓄意攻击实验中子团数量变化情况
Largest connected component during static attack experiments on the seven networks(the smaller, the better)七个网络受到蓄意攻击中最大连通子团的统计情况(越小越好) (a) 最大连通子团平均值情况; (b) 最大连通子团最值情况
Fig. 6. Largest connected component during static attack experiments on the seven networks(the smaller, the better)七个网络受到蓄意攻击中最大连通子团的统计情况(越小越好) (a) 最大连通子团平均值情况; (b) 最大连通子团最值情况
The number of components during static attack experiments on the seven networks (the larger, the better)七个网络静态攻击重要节点的子团数量的统计情况(越大越好) (a) 子团数量平均值情况; (b) 子团数量最值情况
Fig. 7. The number of components during static attack experiments on the seven networks (the larger, the better)七个网络静态攻击重要节点的子团数量的统计情况(越大越好) (a) 子团数量平均值情况; (b) 子团数量最值情况
SI propagation model diagram.SI传播模型图
Fig. 8. SI propagation model diagram.SI传播模型图
Change of infected nodes in Power of American Electric Power network under SI propagation model.美国电力网power在SI传播模型下感染节点的变化情况
Fig. 9. Change of infected nodes in Power of American Electric Power network under SI propagation model.美国电力网power在SI传播模型下感染节点的变化情况
Changes of infection nodes in C. Elegans network under SI propagation model.大肠杆菌代谢网络C. Elegans在SI传播模型下感染节点的变化情况
Fig. 10. Changes of infection nodes in C. Elegans network under SI propagation model.大肠杆菌代谢网络C. Elegans在SI传播模型下感染节点的变化情况
The statistical result of infected nodes of seven network (the larger, the better)七个网络传播感染节点的统计情况(越大越好) (a) SI传播节点数量比较平均值; (b) SI传播节点数量比较最值
Fig. 11. The statistical result of infected nodes of seven network (the larger, the better)七个网络传播感染节点的统计情况(越大越好) (a) SI传播节点数量比较平均值; (b) SI传播节点数量比较最值
网络节点数量边数量平均度值聚集系数平均路径长度同配系数
LesMiserables772546.5970.7362.641–0.4756
PowerGrid494165942.6690.10718.9890.4616
Email1134655611.5630.5261.992–0.0436
Coauthor158927423.4510.8785.8230.0035
Dolphin621595.1290.3033.357–0.1652
C.Elegans45345969.0070.6572.664–0.1085
Club34782.290.5882.408–0.2145
Table 1.

Several basic network information used in this paper.

本文中用到的几个网络基本信息

DRBCECDegreeK-shellMKV
C.Elegans66.225%88.962%8.830%2.208%40.839%
Club61.765%79.412%32.353%11.765%47.059%
Coauthors9.880%29.264%1.447%0.692%9.880%
Dolphin87.097%96.774%19.355%6.452%70.968%
Email62.346%94.533%4.586%0.970%53.263%
Power59.279%86.217%0.324%0.101%8.561%
LesMiserables41.558%67.532%23.377%10.390%37.662%
Table 2.

Value of Centrality Distinction in Different Networks(the larger, the better).

中心性的区分度在不同网络中的取值情况(越大越好)

Kai-Li Wang, Chun-Xue Wu, Jun Ai, Zhan Su. Complex network centrality method based on multi-order K-shell vector[J]. Acta Physica Sinica, 2019, 68(19): 196402-1
Download Citation