
Xueping Ding, Qi Zhang, Honglin Ma. Effect of Solution‑Aging Treatment on Corrosion Resistance of Ti6Al4V via Laser Wire Vacuum Additive Manufacturing[J]. Chinese Journal of Lasers, 2023, 50(24): 2402305
- Chinese Journal of Lasers
- Vol. 50, Issue 24, 2402305 (2023)
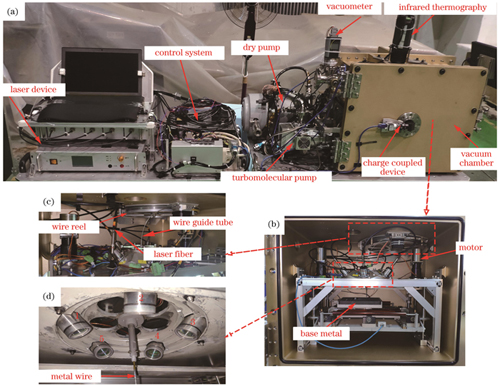
Fig. 1. Experimental equipment for laser wire vacuum additive manufacturing. (a) Overall equipment; (b) equipment in vacuum chamber; (c) wire feeding system; (d) laser and wire arrangement
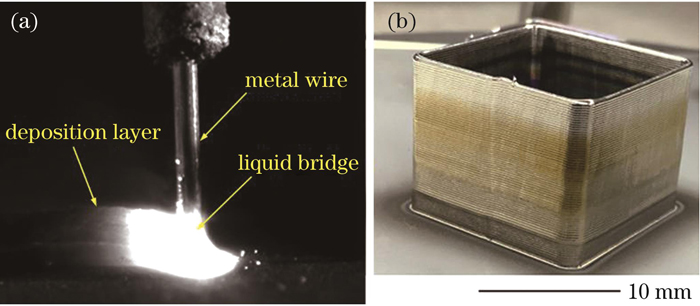
Fig. 2. Additive manufacturing of thin-wall part. (a) Figure of liquid bridge transfer; (b) sample
Fig. 3. Polarization curves of different samples in NaCl solution with mass fraction of 3.5%
Fig. 4. EIS measurement results. (a) Nyquist plots; (b)(c) Bode plots; (d) equivalent circuit model
Fig. 5. XPS full spectra of passive films formed on different sample surfaces
Fig. 6. High-resolution XPS spectra of passive films formed on different sample surfaces. (a)(d)(g) Ti 2p; (b)(e)(h) O 1s; (c)(f)(i) Al 2p
Fig. 7. Valence distributions of Ti elements in passive films formed on different sample surfaces
Fig. 8. IPFs of different samples. (a) AM; (b) SAT500; (c) SAT600
Fig. 9. Phase distributions in different samples
Fig. 10. Grain size distributions in different samples. (a) AM; (b) SAT500; (c) SAT600
Fig. 11. KAM maps of different samples. (a) AM; (b) SAT500; (c) SAT600
Fig. 12. Grain boundary distributions and statistics results in different samples. (a)(d) AM; (b)(e) SAT500; (c)(f) SAT600
|
Table 1. Process parameters of solution aging heat treatment
|
Table 2. Corrosion potential and corrosion current density values of different samples
|
Table 3. EIS parameters of equivalent circuit for test samples
| |||||||||||||||||||||||||||||||||||||||||||||||
Table 4. Results of peak fitting of high-resolution XPS spectra

Set citation alerts for the article
Please enter your email address
© Copyright 2018-2021 | Chinese Laser Press. All Rights Reserved 沪ICP备15018463号-20