
Xiangjun Li, Jie Yin, Jianjun Liu, Fangzhou Shu, Tingting Lang, Xufeng Jing, Zhi Hong, "Resonant transparency of a planar anapole metamaterial at terahertz frequencies," Photonics Res. 9, 125 (2021)
- Photonics Research
- Vol. 9, Issue 2, 125 (2021)
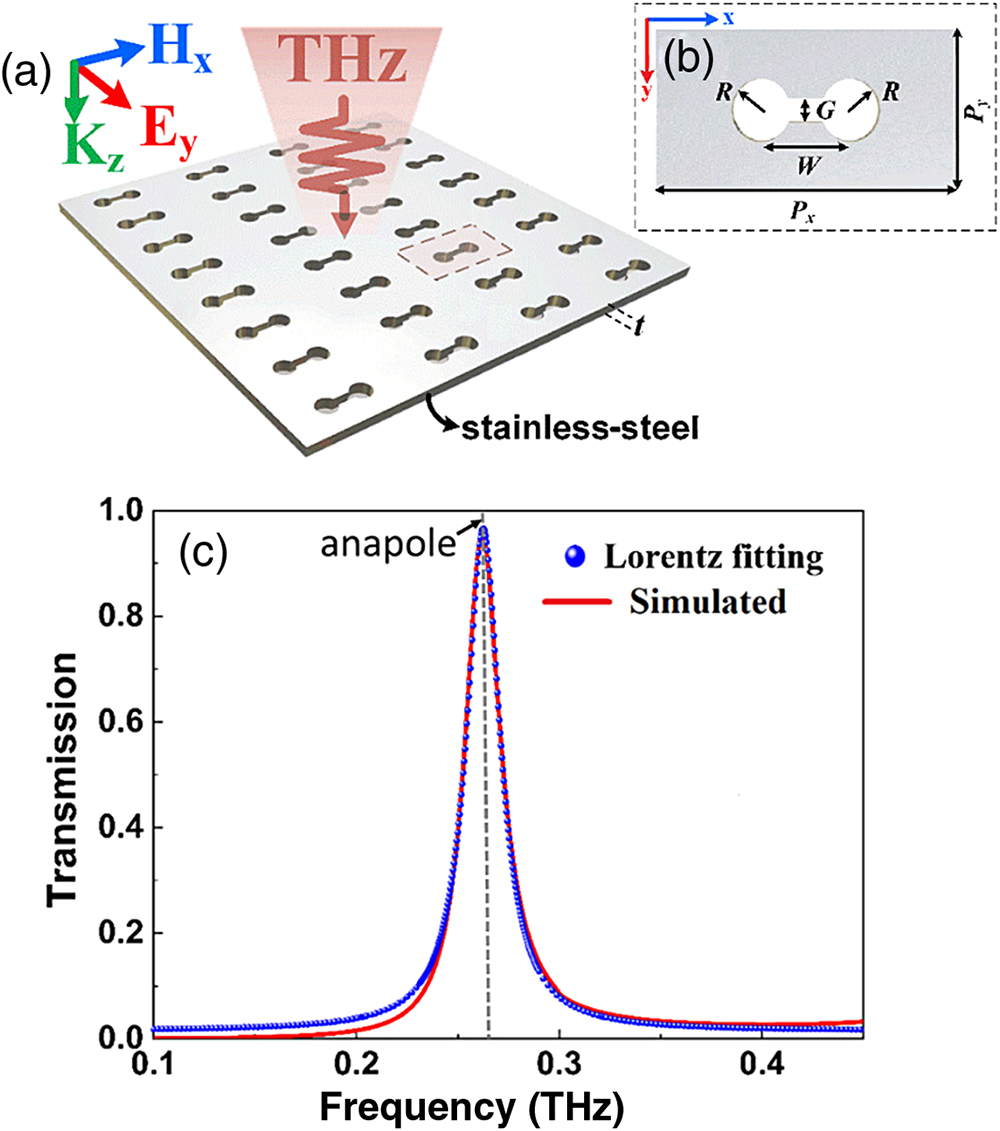
Fig. 1. (a), (b) Schematic of a planar anapole metamaterial with dumbbell-shaped apertures, which is illuminated by a normally incident plane wave with the electric field along the y axis. The structure parameters are radius R G W P x = 1,000 μm P y = 500 μm t = 200 μm R = 100 W = 300 G = 75 μm
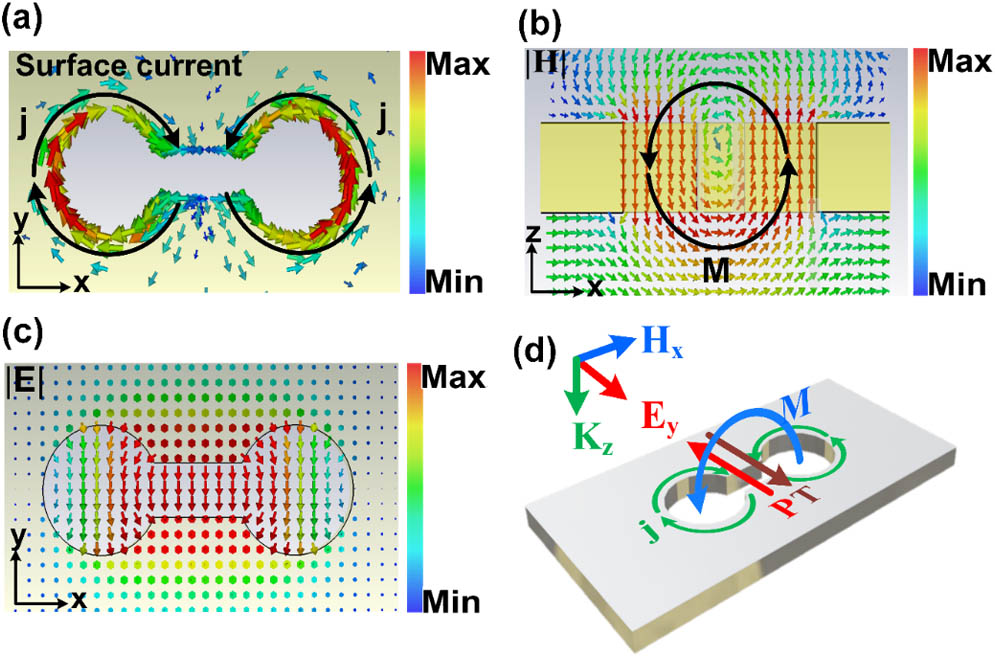
Fig. 2. (a) Surface current in the x -y plane, (b) magnetic field in the x -z plane, and (c) electric field in the x -y plane at the resonance of 0.26 THz for the planar metamaterial. The black arrows represent the direction of the surface current and magnetic field in (a) and (b), respectively. (d) Schematic of the excitation of toroidal dipole T P M j represents the surface current.
Fig. 3. (a) Five leading scattered powers of multipole decomposition for the planar metamaterial, where P M T P i k T
Fig. 4. Transmission spectra of planar metamaterials and corresponding scattered powers of the T P R W = 300 μm G = 75 μm W , when R = 100 μm G = 75 μm G R = 100 μm W = 300 μm P i k T π
Fig. 5. Three anapole resonance bands produced by varying G R W W = 300 μm R = 100 μm W = 150 μm R = 50 μm W = 100 μm R = 33 μm
Fig. 6. Measured (solid line) and simulated (dotted line) transmission spectra of four anapole metamaterials with different values of G = 33 R = 100 μm W = 300 μm G = 78 μm
|
Table 1. Three Anapole Resonance Bands with Different Structural Parameters


Set citation alerts for the article
Please enter your email address

© Copyright 2018-2021 | Chinese Laser Press. All Rights Reserved 沪ICP备15018463号-20