• Matter and Radiation at Extremes
  • Vol. 7, Issue 6, 064403 (2022)
Defeng Kong1、*, Guoqiang Zhang2, Yinren Shou1, Shirui Xu1, Zhusong Mei1, Zhengxuan Cao1, Zhuo Pan1, Pengjie Wang1, Guijun Qi1, Yao Lou2, Zhiguo Ma3, Haoyang Lan1、4, Wenzhao Wang5, Yunhui Li6, Peter Rubovic7、8, Martin Veselsky7, Aldo Bonasera0、9, Jiarui Zhao1, Yixing Geng1, Yanying Zhao1, Changbo Fu3, Wen Luo4, Yugang Ma2、3, Xueqing Yan0、0、1, and Wenjun Ma0、0、1
Author Affiliations
  • 0Beijing Laser Acceleration Innovation Center, Huairou, Beijing 101400, China
  • 0Collaborative Innovation Center of Extreme Optics, Shanxi University, Taiyuan, Shanxi 030006, China
  • 0Laboratori Nazionali del Sud, INFN, via Santa Sofia, 62, Catania 95123, Italy
  • 1State Key Laboratory of Nuclear Physics and Technology, and Key Laboratory of HEDP of the Ministry of Education, CAPT, School of Physics, Peking University, Beijing 100871, China
  • 2Shanghai Institute of Applied Physics, Chinese Academy of Sciences, Shanghai 201800, China
  • 3Key Laboratory of Nuclear Physics and Ion-Beam Application (MOE), Institute of Modern Physics, Fudan University, Shanghai 200433, China
  • 4School of Nuclear Science and Technology, University of South China, Hengyang 421001, China
  • 5INPAC and School of Physics and Astronomy, Shanghai Jiao Tong University, Shanghai 200240, China
  • 6Shenzhen Institutes of Advanced Technology, Chinese Academy of Sciences, Shenzhen 518055, China
  • 7Institute of Experimental and Applied Physics, Czech Technical University in Prague, Husova 240/5, 11000 Prague 1, Czech Republic
  • 8ELI Beamlines Center, Institute of Physics of the Czech Academy of Sciences, 252 41 Dolní Břežany, Czechia
  • 9Cyclotron Institute, Texas A&M University, College Station, Texas 77843, USA
  • show less
    DOI: 10.1063/5.0120845 Cite this Article
    Defeng Kong, Guoqiang Zhang, Yinren Shou, Shirui Xu, Zhusong Mei, Zhengxuan Cao, Zhuo Pan, Pengjie Wang, Guijun Qi, Yao Lou, Zhiguo Ma, Haoyang Lan, Wenzhao Wang, Yunhui Li, Peter Rubovic, Martin Veselsky, Aldo Bonasera, Jiarui Zhao, Yixing Geng, Yanying Zhao, Changbo Fu, Wen Luo, Yugang Ma, Xueqing Yan, Wenjun Ma. High-energy-density plasma in femtosecond-laser-irradiated nanowire-array targets for nuclear reactions[J]. Matter and Radiation at Extremes, 2022, 7(6): 064403 Copy Citation Text show less
    (a) Schematic diagram of an NWA target; L, D, and S are the NW length, diameter, and spacing, respectively. (b) Schematic showing plasma heating and ion acceleration in an NWA target.
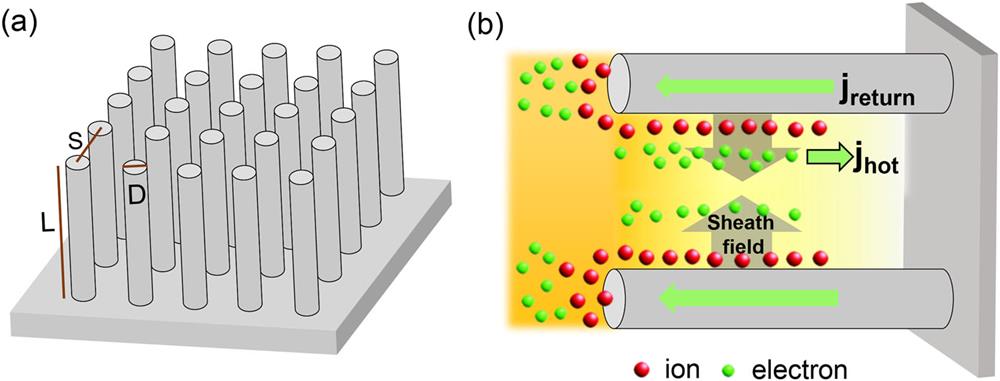
    Fig. 1. (a) Schematic diagram of an NWA target; L, D, and S are the NW length, diameter, and spacing, respectively. (b) Schematic showing plasma heating and ion acceleration in an NWA target.
    2D PIC simulation results. (a) Spatial distribution of the electric field Ey and electron density ne at t = 150 fs. (b) Total laser absorption ratio and the fraction of the laser energy converted into ions and electrons over the simulation time for the planar and NWA targets. (c) Spatial distribution of the electron density at t = 210 fs; the black line shows the sheath field Esx along the x axis at y = 0. (d) Spatial distribution of the sheath field Esy at t = 210 fs; the red line shows the sheath fields Esy along the y axis at x = 4 μm (e) and (f) Spatial distributions of the proton densities at t = 210 fs and t = 460 fs, respectively.
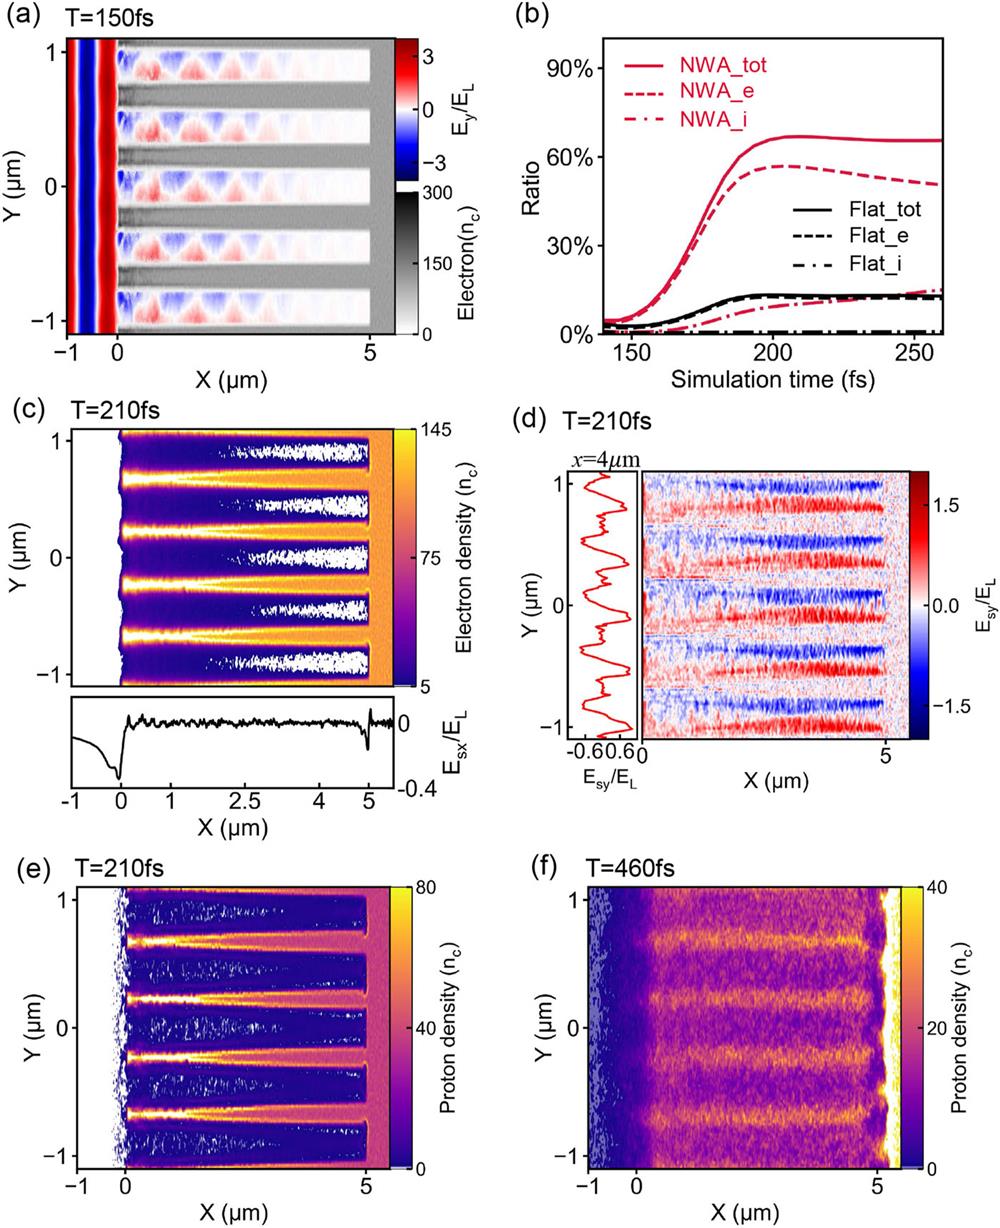
    Fig. 2. 2D PIC simulation results. (a) Spatial distribution of the electric field Ey and electron density ne at t = 150 fs. (b) Total laser absorption ratio and the fraction of the laser energy converted into ions and electrons over the simulation time for the planar and NWA targets. (c) Spatial distribution of the electron density at t = 210 fs; the black line shows the sheath field Esx along the x axis at y = 0. (d) Spatial distribution of the sheath field Esy at t = 210 fs; the red line shows the sheath fields Esy along the y axis at x = 4 μm (e) and (f) Spatial distributions of the proton densities at t = 210 fs and t = 460 fs, respectively.
    Confined and emitted protons. (a) x–px and x–py phase diagrams of the protons at t = 460 fs. (b) Angular distribution of the protons at t = 460 fs; the green dashed line shows the integral of the energies at different angles. (c) Energy spectra of the confined and emitted protons at t = 460 fs; the dashed lines show the fitted temperatures of the protons.
    Fig. 3. Confined and emitted protons. (a) xpx and xpy phase diagrams of the protons at t = 460 fs. (b) Angular distribution of the protons at t = 460 fs; the green dashed line shows the integral of the energies at different angles. (c) Energy spectra of the confined and emitted protons at t = 460 fs; the dashed lines show the fitted temperatures of the protons.
    Spatial distributions and line plots (y = 0) of (a) EED and (b) PED for a planar target and a typical NWA target at a simulation time of t = 460 fs.
    Fig. 4. Spatial distributions and line plots (y = 0) of (a) EED and (b) PED for a planar target and a typical NWA target at a simulation time of t = 460 fs.
    Spatial distribution of PED for NWA targets with (a) L = 5 μm, (b) L = 2 μm, (c) L = 1 μm (D = 200 nm, S = 450 nm), and (d) L = 5 μm (D = 300 nm, S = 450 nm) (e) and (f) PEDs of different targets along the x and y directions, respectively.
    Fig. 5. Spatial distribution of PED for NWA targets with (a) L = 5 μm, (b) L = 2 μm, (c) L = 1 μm (D = 200 nm, S = 450 nm), and (d) L = 5 μm (D = 300 nm, S = 450 nm) (e) and (f) PEDs of different targets along the x and y directions, respectively.
    Simulation results as functions of NW diameter: (a) laser absorption ratio and confined electron temperature, (b) confined proton temperature and number of confined protons (>1 keV), and (c) energy proportions of emitted and confined protons. Panels (d)–(f) show the same results as functions NW length. Other NWA parameters were S = 450 nm, L = 5 μm in panels (a)–(c) and D = 200 nm, S = 450 nm in panels (d)–(f).
    Fig. 6. Simulation results as functions of NW diameter: (a) laser absorption ratio and confined electron temperature, (b) confined proton temperature and number of confined protons (>1 keV), and (c) energy proportions of emitted and confined protons. Panels (d)–(f) show the same results as functions NW length. Other NWA parameters were S = 450 nm, L = 5 μm in panels (a)–(c) and D = 200 nm, S = 450 nm in panels (d)–(f).
    (a) Schematic of the experimental setup. SEM images: (b) top and (c) side views of an NWA target.
    Fig. 7. (a) Schematic of the experimental setup. SEM images: (b) top and (c) side views of an NWA target.
    Experimental and simulated maximum proton energy results for varying the (a) diameters and (b) lengths of the NWs in the array. The other parameters of the NWA are S = 450 nm/S = 800 nm, L = 5 μm in (a) and D = 200 nm, S = 450 nm in (b). Panels (c) and (d) depict the proton spectra in (a) and (b), respectively, in which an NWA target with D = 200 nm, S = 450 nm, and L = 5 μm is abbreviated as 200-450-5.
    Fig. 8. Experimental and simulated maximum proton energy results for varying the (a) diameters and (b) lengths of the NWs in the array. The other parameters of the NWA are S = 450 nm/S = 800 nm, L = 5 μm in (a) and D = 200 nm, S = 450 nm in (b). Panels (c) and (d) depict the proton spectra in (a) and (b), respectively, in which an NWA target with D = 200 nm, S = 450 nm, and L = 5 μm is abbreviated as 200-450-5.
    (a) Angular distribution of protons; error bars represent the standard deviations of the statistics. Panels (b)–(d) show the raw data of CR39 surfaces with the same sizes at angles of 20°, 55°, and 80° with respect to the target normal, respectively.
    Fig. 9. (a) Angular distribution of protons; error bars represent the standard deviations of the statistics. Panels (b)–(d) show the raw data of CR39 surfaces with the same sizes at angles of 20°, 55°, and 80° with respect to the target normal, respectively.
    Ion spectra: TPS raw data (a) without and (b) with 20 μm aluminum foil. (c) Projected range in aluminum foil for protons and deuterium and carbon ions. Energy spectra of ions with (d) CMR = 1 (proton) and (e) CMR = 1/2 (deuterium or carbon ion).
    Fig. 10. Ion spectra: TPS raw data (a) without and (b) with 20 μm aluminum foil. (c) Projected range in aluminum foil for protons and deuterium and carbon ions. Energy spectra of ions with (d) CMR = 1 (proton) and (e) CMR = 1/2 (deuterium or carbon ion).
    (a) Deuterium energy density at a simulation time of t = 460 fs. (b) Spatial distribution of the density of helium ions at t = 460 fs. Simulated helium (neutron) yield for different NW (c) lengths and (d) diameters at a simulation time of t = 3 ps. The error bars represent the statistical fluctuations. The theoretical value of neutron yield from an NWA target with D = 200 nm, S = 450 nm, and L = 5 μm and the average neutron yield in the experiments from different NWA parameters are also shown in panel (c).
    Fig. 11. (a) Deuterium energy density at a simulation time of t = 460 fs. (b) Spatial distribution of the density of helium ions at t = 460 fs. Simulated helium (neutron) yield for different NW (c) lengths and (d) diameters at a simulation time of t = 3 ps. The error bars represent the statistical fluctuations. The theoretical value of neutron yield from an NWA target with D = 200 nm, S = 450 nm, and L = 5 μm and the average neutron yield in the experiments from different NWA parameters are also shown in panel (c).
    TargetD (nm)S (nm)L (μm)ρav/ρsThickness (μm)
    NWA2004501,2,4,5,100.16
    30045050.35450 ± 50
    500/60080050.31/0.45
    Planar450 ± 50
    Table 1. Parameters of all NWA and planar targets.
    Defeng Kong, Guoqiang Zhang, Yinren Shou, Shirui Xu, Zhusong Mei, Zhengxuan Cao, Zhuo Pan, Pengjie Wang, Guijun Qi, Yao Lou, Zhiguo Ma, Haoyang Lan, Wenzhao Wang, Yunhui Li, Peter Rubovic, Martin Veselsky, Aldo Bonasera, Jiarui Zhao, Yixing Geng, Yanying Zhao, Changbo Fu, Wen Luo, Yugang Ma, Xueqing Yan, Wenjun Ma. High-energy-density plasma in femtosecond-laser-irradiated nanowire-array targets for nuclear reactions[J]. Matter and Radiation at Extremes, 2022, 7(6): 064403
    Download Citation