• Chinese Physics B
  • Vol. 29, Issue 9, (2020)
Yuying Jiang1、2, Guangming Li1、2、3, Ming Lv1、2、3, Hongyi Ge1、2、3、†, and Yuan Zhang1、2
Author Affiliations
  • 1Key Laboratory of Grain Information Processing and Control (Henan University of Technology), Ministry of Education, Zhengzhou 45000, China
  • 2Henan Provincial Key Laboratory of Grain Photoelectric Detection and Control, Zhengzhou 450001, China
  • 3College of Information Science and Engineering, Henan University of Technology, Zhengzhou 450001, China
  • show less
    DOI: 10.1088/1674-1056/ab9f25 Cite this Article
    Yuying Jiang, Guangming Li, Ming Lv, Hongyi Ge, Yuan Zhang. Determination of potassium sorbate and sorbic acid in agricultural products using THz time-domain spectroscopy[J]. Chinese Physics B, 2020, 29(9): Copy Citation Text show less
    THz time-domain spectra of the PS and SA.
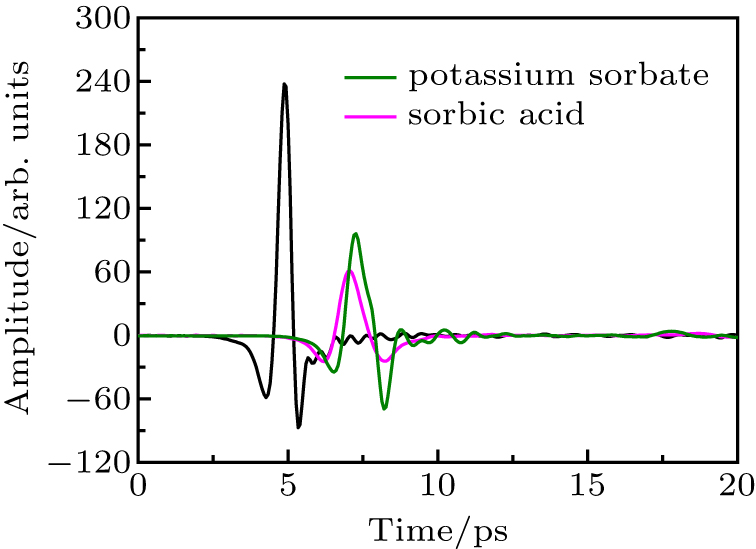
    Fig. 1. THz time-domain spectra of the PS and SA.
    Absorption coefficients and refractive indices of the (a) PS and (b) SA.
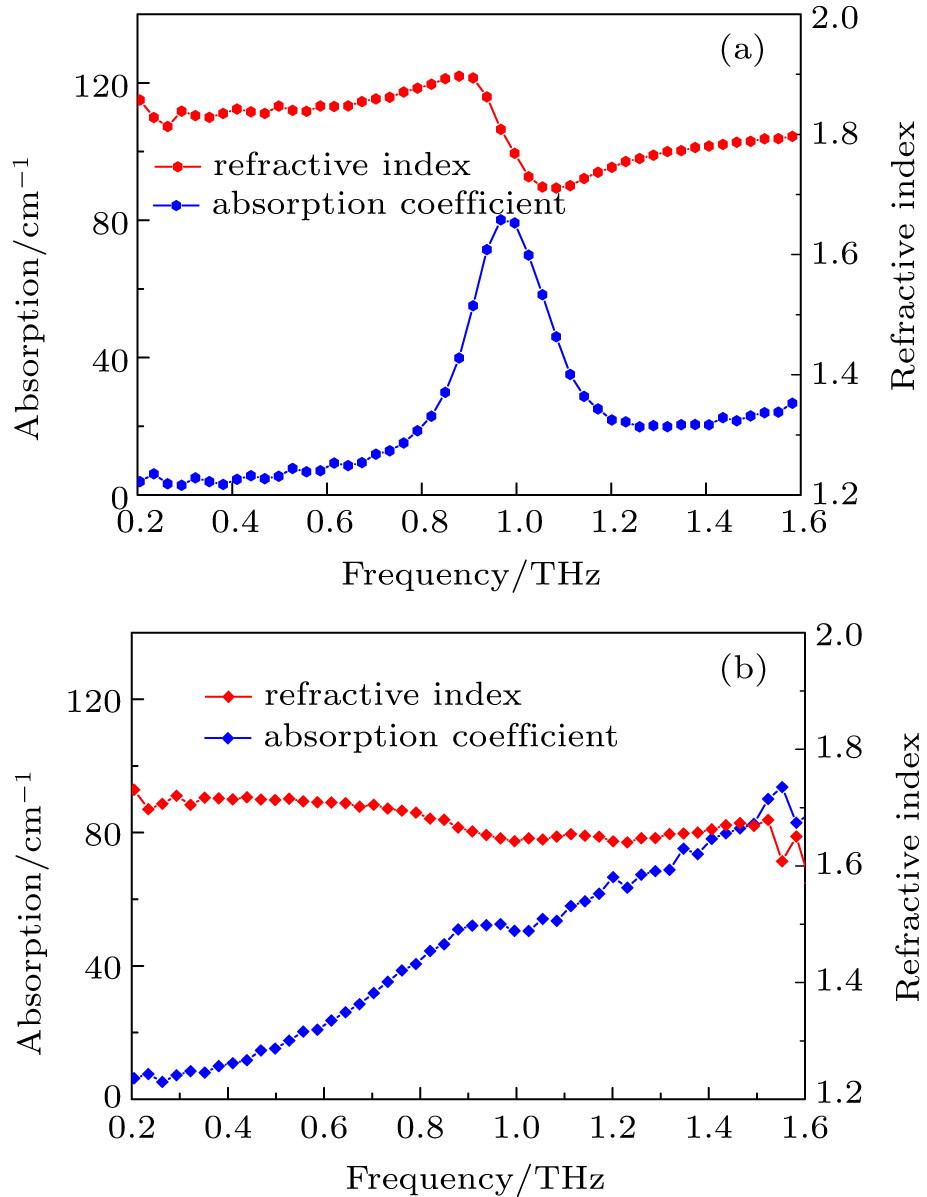
    Fig. 2. Absorption coefficients and refractive indices of the (a) PS and (b) SA.
    THz absorption spectrum of PS and wheat/polyethylene mixture.
    Fig. 3. THz absorption spectrum of PS and wheat/polyethylene mixture.
    THz absorption spectrum in SA and wheat/polyethylene mixtures.
    Fig. 4. THz absorption spectrum in SA and wheat/polyethylene mixtures.
    iPLS results for 12 subintervals in the absorption spectrum from PS.
    Fig. 5. iPLS results for 12 subintervals in the absorption spectrum from PS.
    PSO fitness function for (a) PS and wheat mixtures, and (b) SA and wheat mixtures.
    Fig. 6. PSO fitness function for (a) PS and wheat mixtures, and (b) SA and wheat mixtures.
    Scatter plots of the predicted vs. actual value in (a) PS and wheat/PE mixture, and (b) SA and wheat/PE mixture with the PSO-SVC model.
    Fig. 7. Scatter plots of the predicted vs. actual value in (a) PS and wheat/PE mixture, and (b) SA and wheat/PE mixture with the PSO-SVC model.
    No.PS/SA/mgPE/wheat/mgConcentration/%
    102000
    251952.5
    3101905
    42018010
    53017015
    64016020
    76014030
    88012040
    910010050
    102000100
    Table 1. Component of mixture.
    No.Frequency range/THzRMSECVR
    Full spectrum0.2–1.61.01980.932
    The 1st subinterval0.2–0.3171.21350.898
    The 2nd subinterval0.317–0.4341.08320.942
    The 3rd subinterval0.434–0.5511.08630.991
    The 4th subinterval0.551–0.6680.68820.989
    The 5th subinterval0.668–0.7850.37540.996
    The 6th subinterval0.785–0.9020.23190.998
    The 7th subinterval0.902–1.0190.40730.997
    The 8th subinterval1.019–1.1360.46210.996
    The 9th subinterval1.136–1.2530.90030.935
    The 10th subinterval1.253–1.370.77120.990
    The 11th subinterval1.37–1.4871.02140.936
    The 12th subinterval1.487–1.61.24650.896
    Table 2. iPLS wave screening results for 12 subintervals of the absorption spectrum from PS.
    No. of subintervalsFeature frequency ranges/THzAverage RMSECVAverage R
    100.48–1.460.86530.9513
    110.454–1.470.84640.9598
    120.551–1.4870.75210.9637
    130.546–1.4960.79070.9621
    140.5–1.50.87630.9465
    150.479–1.5020.85830.95587
    160.552–1.520.89060.9476
    Table 3. iPLS wave screening results for different subintervals of the PS spectra.
    SampleFrequency range/THzcgPrediction
    Correction set/%Prediction set/%
    PS + wheat0.2–1.62.1631.03296.65393.672
    0.551–1.4871.2840.86397.76595.356
    PS + PE0.2–1.62.0260.96597.35695.685
    0.551–1.4871.2060.84398.6596.657
    SA + wheat0.2–1.61.9821.10397.47395.890
    0.454–1.2161.3740.90698.3297.242
    SA + PE0.2–1.61.8651.21498.65697.356
    0.454–1.2161.1790.86799.0198.013
    Table 4. Prediction results with different PSO-SVC models.
    Yuying Jiang, Guangming Li, Ming Lv, Hongyi Ge, Yuan Zhang. Determination of potassium sorbate and sorbic acid in agricultural products using THz time-domain spectroscopy[J]. Chinese Physics B, 2020, 29(9):
    Download Citation