• Acta Physica Sinica
  • Vol. 69, Issue 1, 014209-1 (2020)
Qi-Wei Xu1、2, Pei-Pei Wang1、2, Zhen-Jia Zeng2, Ze-Bin Huang2, Xin-Xing Zhou3, Jun-Min Liu1、*, Ying Li2, Shu-Qing Chen2, and Dian-Yuan Fan2
Author Affiliations
  • 1College of New Materials and New Energies, Shenzhen Technology University, Shenzhen 518118, China
  • 2Engineering Technology Research Center for 2D Material Information Function Devices and Systems of Guangdong Province, International Collaborative Laboratory of 2D Materials for Optoelectronics Science and Technology, Shenzhen University, Shenzhen 518060, China
  • 3Synergetic Innovation Center for Quantum Effects and Applications, School of Physics and Electronics, Hunan Normal University, Changsha 410081, China
  • show less
    DOI: 10.7498/aps.69.20190982 Cite this Article
    Qi-Wei Xu, Pei-Pei Wang, Zhen-Jia Zeng, Ze-Bin Huang, Xin-Xing Zhou, Jun-Min Liu, Ying Li, Shu-Qing Chen, Dian-Yuan Fan. Extracting atmospheric turbulence phase using deep convolutional neural network[J]. Acta Physica Sinica, 2020, 69(1): 014209-1 Copy Citation Text show less
    Random phase screen at each turbulence intensity: (a), (b) ; (c), (d) ; (e), (f) .各湍流强度下的随机相位屏 (a), (b) ; (c), (d) ; (e), (f)
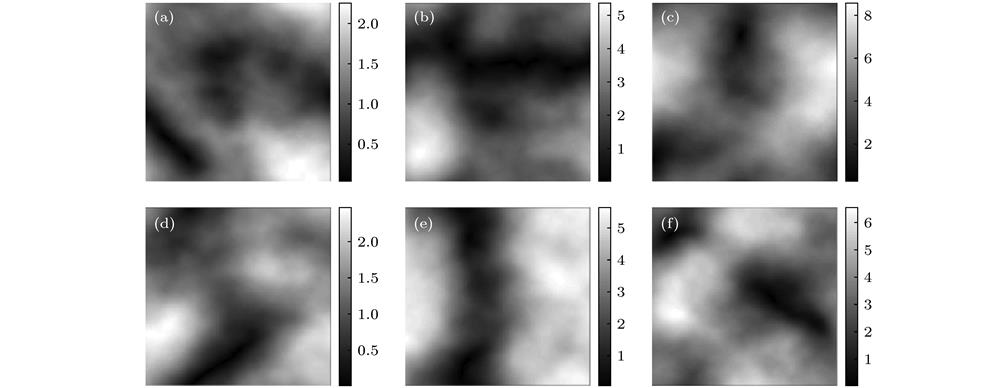
    Fig. 1. Random phase screen at each turbulence intensity: (a), (b) ; (c), (d) ; (e), (f) . 各湍流强度下的随机相位屏 (a), (b) ; (c), (d) ; (e), (f)
    The cross-section spot of transmission beam at each turbulence intensity: (a) Initial Gaussian beam; (b), (c) ; (d), (e) ; (f), (g) .各湍流强度影响下传输光束截面光斑 (a)初始高斯光束; (b), (c) ; (d), (e) ; (f), (g)
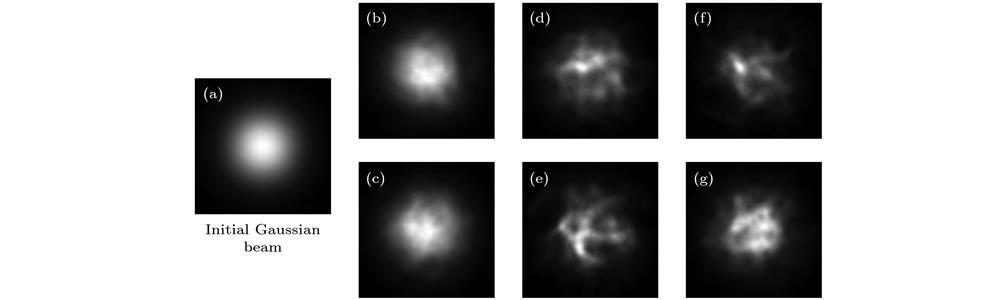
    Fig. 2. The cross-section spot of transmission beam at each turbulence intensity: (a) Initial Gaussian beam; (b), (c) ; (d), (e) ; (f), (g) . 各湍流强度影响下传输光束截面光斑 (a)初始高斯光束; (b), (c) ; (d), (e) ; (f), (g)
    The CNN structure of extracting the turbulent phase.提取湍流相位的CNN结构
    Fig. 3. The CNN structure of extracting the turbulent phase.提取湍流相位的CNN结构
    The loss function curve of training process.训练过程损失函数曲线
    Fig. 4. The loss function curve of training process.训练过程损失函数曲线
    The turbulent phase during the training process: The number of iterations of (a) and (b), (c) and (d), (e) and (f), (g) and (h), (i) and (j), and (k) and (l) is 1, 100, 500, 4000, 8000, 14000.训练过程提取到的湍流相 (a)与(b), (c)与(d), (e)与(f), (g)与(h), (i)与(j)和(k)与(l)的迭代次数分别为1, 100, 500, 4000, 8000, 14000
    Fig. 5. The turbulent phase during the training process: The number of iterations of (a) and (b), (c) and (d), (e) and (f), (g) and (h), (i) and (j), and (k) and (l) is 1, 100, 500, 4000, 8000, 14000.训练过程提取到的湍流相 (a)与(b), (c)与(d), (e)与(f), (g)与(h), (i)与(j)和(k)与(l)的迭代次数分别为1, 100, 500, 4000, 8000, 14000
    The loss function curve at each turbulence intensity.各湍流强度损失函数曲线
    Fig. 6. The loss function curve at each turbulence intensity.各湍流强度损失函数曲线
    The predicted turbulent phase based on CNN at each turbulence intensity: (a), (b), (c) Initial Gaussian beam; (d), (e), (f) Gaussian beam affected by atmospheric turbulence; (g), (h), (i) the actual turbulence phase; (j), (k), (l) the output phase of CNN.不同湍流强度下, 经过CNN提取到的湍流相位 (a), (b), (c)初始高斯光束; (d), (e), (f) 受大气湍流影响的高斯光束; (g), (h), (i)实际的大气湍流相位; (j), (k), (l) CNN输出的预测湍流相位
    Fig. 7. The predicted turbulent phase based on CNN at each turbulence intensity: (a), (b), (c) Initial Gaussian beam; (d), (e), (f) Gaussian beam affected by atmospheric turbulence; (g), (h), (i) the actual turbulence phase; (j), (k), (l) the output phase of CNN.不同湍流强度下, 经过CNN提取到的湍流相位 (a), (b), (c)初始高斯光束; (d), (e), (f) 受大气湍流影响的高斯光束; (g), (h), (i)实际的大气湍流相位; (j), (k), (l) CNN输出的预测湍流相位
    The comparison of CNN and GS algorithm for extracting turbulence phase: (a), (b), (c) Gaussian beam affected by atmospheric turbulence with ; (d), (e), (f) the actual turbulence phase; (g), (h), (i) the predicted turbulent phase based on CNN; (j), (k), (l) the predicted turbulent phase based on GS algorithm.CNN与GS算法提取湍流相位效果对比 (a), (b), (c)受湍流强度为影响的高斯光束; (d), (e), (f)实际湍流相位; (g), (h), (i)基于CNN模型提取的湍流相位; (j), (k), (l) GS算法提取的湍流相位
    Fig. 8. The comparison of CNN and GS algorithm for extracting turbulence phase: (a), (b), (c) Gaussian beam affected by atmospheric turbulence with ; (d), (e), (f) the actual turbulence phase; (g), (h), (i) the predicted turbulent phase based on CNN; (j), (k), (l) the predicted turbulent phase based on GS algorithm. CNN与GS算法提取湍流相位效果对比 (a), (b), (c)受湍流强度为 影响的高斯光束; (d), (e), (f)实际湍流相位; (g), (h), (i)基于CNN模型提取的湍流相位; (j), (k), (l) GS算法提取的湍流相位
    Training and validation set test results: (a) The loss function curve of training process; (b) the predicted turbulence phase obtained by testing the validation set during training.训练及验证测试结果 (a)训练过程损失函数曲线; (b)训练过程中利用验证集测试得到的预测湍流相位
    Fig. 9. Training and validation set test results: (a) The loss function curve of training process; (b) the predicted turbulence phase obtained by testing the validation set during training.训练及验证测试结果 (a)训练过程损失函数曲线; (b)训练过程中利用验证集测试得到的预测湍流相位
    ParameterSimulation Value
    Number of Grid Elements N128
    Grid spacing ${{\varDelta x} / {\rm{cm}}}$About 0.047
    Laser wavelength ${\lambda / {\rm{nm}}}$1550
    Initial ${1 / {\rm{e}}}$ amplitude radius ${{{\omega _0}} / {\rm{cm}}}$2
    Total path length ${L / {\rm{m}}}$20
    Inner scale of Turbulence ${{{l_0}} / {\rm{m}}}$$2 \times {10^{ - 4}}$
    Outer scale of Turbulence ${{{L_0}} / {\rm{m}}}$50
    Number of phase screens n1
    Table 1.

    Parameter of simulation.

    仿真参数

    Data SetAverage time/s
    GS algorithm (70 iterations)CNN model
    $C_{\rm{n}}^2 = 1 \times {10^{ - 14}}\;{{\rm{m}} ^{{{ - 2} / 3}}}$0.390.0049
    $C_{\rm{n}}^2 = 5 \times {10^{ - 14}}\;{{\rm{m}} ^{{{ - 2} / 3}}}$0.390.0048
    $C_{\rm{n}}^2 = 1 \times {10^{ - 13}}\;{{\rm{m}} ^{{{ - 2} / 3}}}$0.410.0051
    Table 2. The predicted time comparison of two methods.
    Qi-Wei Xu, Pei-Pei Wang, Zhen-Jia Zeng, Ze-Bin Huang, Xin-Xing Zhou, Jun-Min Liu, Ying Li, Shu-Qing Chen, Dian-Yuan Fan. Extracting atmospheric turbulence phase using deep convolutional neural network[J]. Acta Physica Sinica, 2020, 69(1): 014209-1
    Download Citation