Abstract
Optical frequency comb with evenly spaced lines over a broad bandwidth has revolutionized the fields of optical metrology and spectroscopy. Here, we propose a fast interleaved dual-comb spectroscopy with sub-femtometer-resolution and absolute frequency, in which two electro-optic frequency combs are swept. Electrically-modulated stabilized laser enables ultrahigh resolution of 0.16 fm (or 20 kHz in optical frequency) and single-shot measurement in 90 ms. Total 20 million points are recorded spanning 3.2 nm (or 400 GHz) bandwidth, corresponding to a spectral sampling rate of 2.5 × 10⁸ points/s under Nyquist-limitation. Besides, considering the trade-off between the measurement time and spectral resolution, a fast single-shot measurement is also realized in 1.6 ms with 8 fm (or 1 MHz) resolution. We demonstrate the 25-averaged result with 30.6 dB spectral measurement signal-to-noise ratio (SNR) by reducing the filter bandwidth in demodulation. The results show great prospect for precise measurement with flexibly fast refresh time, high spectral resolution, and high SNR.Optical frequency comb with evenly spaced lines over a broad bandwidth has revolutionized the fields of optical metrology and spectroscopy. Here, we propose a fast interleaved dual-comb spectroscopy with sub-femtometer-resolution and absolute frequency, in which two electro-optic frequency combs are swept. Electrically-modulated stabilized laser enables ultrahigh resolution of 0.16 fm (or 20 kHz in optical frequency) and single-shot measurement in 90 ms. Total 20 million points are recorded spanning 3.2 nm (or 400 GHz) bandwidth, corresponding to a spectral sampling rate of 2.5 × 10⁸ points/s under Nyquist-limitation. Besides, considering the trade-off between the measurement time and spectral resolution, a fast single-shot measurement is also realized in 1.6 ms with 8 fm (or 1 MHz) resolution. We demonstrate the 25-averaged result with 30.6 dB spectral measurement signal-to-noise ratio (SNR) by reducing the filter bandwidth in demodulation. The results show great prospect for precise measurement with flexibly fast refresh time, high spectral resolution, and high SNR.Introduction
Optical frequency combs (OFCs)1, 2, originally built from femtosecond mode-locked lasers (MLLs), have revolutionized the field of spectroscopy with phase coherent spectral lines and broad bandwidth3-5. Several techniques are developed to extract the spectroscopic content encoded on the comb lines, such as virtually imaged phased arrays (VIPA)-based spectroscopy6 and Fourier transform spectroscopy (FTS)7. Dual-comb spectroscopy (DCS) emerges from comb-based techniques and has been implemented in linear spectroscopy8-13, nonlinear spectroscopy14, 15 and microscopy16, 17. Beating two OFCs with slightly different repetition rates, DCS retrieves each frequency component in radio frequency (RF) domain, which may fully exploit the spectral resolution and measurement bandwidth determined by OFCs. In recent years, novel approaches for OFC generation have been explored, which facilitate DCS performed at different wavebands with versatility9, 11, 12.
Mutual coherence establishment between two independent combs requires phase-locking circuits10, 18 or phase corrections19-21. OFCs may also be generated by electro-optic modulation from a single seed laser to form a DCS system with intrinsic mutual coherence22-29, which significantly reduces the system complexity. Electro-optic frequency combs (EOFCs)30, 31 have been demonstrated with nonlinearly broadened bandwidth32 or ultra-dense line-spacing33, 34, which promote flexible electro-optic DCS for various spectroscopic applications.
Spectral interleaving technique for comb-based spectroscopy may improve the spectral resolution narrower than the line-spacing, which may be realized by stepping either line-spacing or central frequency13, 35-38. Four interleaved spectra were performed based on MLLs in 25 MHz step36. OFCs with large line-spacing, such as microresonator comb, may be hundreds of times interleaved with a step of 80 MHz by both tuning cavity length and pump laser frequency38. Temperature tuning of quantum cascade laser (QCL) combs37 interleave the spectra to 80 MHz. Tuning the driving current of seed laser improves the EOFC spectral resolution from 25 GHz to 100 MHz39. The spectral resolution with interleaved combs is commonly limited by the frequency accuracy during the adjustment of comb line frequency. Besides, long measurement time may weaken one significant superiority of DCS to realize Nyquist-limited spectral sampling rate40.
In this paper, we propose a fast interleaved dual-comb spectroscopy with sub-femtometer resolution and absolute frequency, which simultaneously realizes high spectral resolution, large bandwidth and fast measurement speed under the Nyquist-limitation. The stabilized seed laser provides absolute optical frequency reference and is used to generate the swept lightwave by external RF modulation with low sweep nonlinear error, and fast sweep speed. The probe and local EOFCs seeded by the swept source have a slight repetition rate difference to build a dual-comb interferometer. Each comb-line pair records a high-resolution spectrum and is located to a different frequency in electrical domain, which may be separated by a digital filter to recover whole spectrum. In experiments, ultrahigh resolution of 0.16 fm (or 20 kHz in optical frequency) is performed in 90 ms, thanks to the high accuracy of electrically modulated frequency. Total 20 million points are recorded spanning 3.2 nm (or 400 GHz) bandwidth. The spectral sampling rate, defined as the acquired spectral point per unit time, reaches 2.5 × 10⁸ points/s, which is one quarter of the analog-to-digital converter (ADC) sampling rate under Nyquist-limitation. Considering the trade-off between sweep time and spectral resolution, a fast measurement may be realized in 1.6 ms with 8 fm (or 1 MHz) resolution for dynamic measurement situation. The high resolution reflectance spectrum of high Q-factor fiber Fabry-Perot cavity is also measured by the ultra-fine EOFC, and the consistent results validate the proposed method. Besides, flexible filter bandwidth adjustment in demodulation enables high signal-to-noise (SNR) measurement of H13CN gas cell at the cost of resolution. The SNR reaches 30.6 dB after averaging in 50 ms with a spectral resolution of 0.4 pm (or 50 MHz).
Operation principles
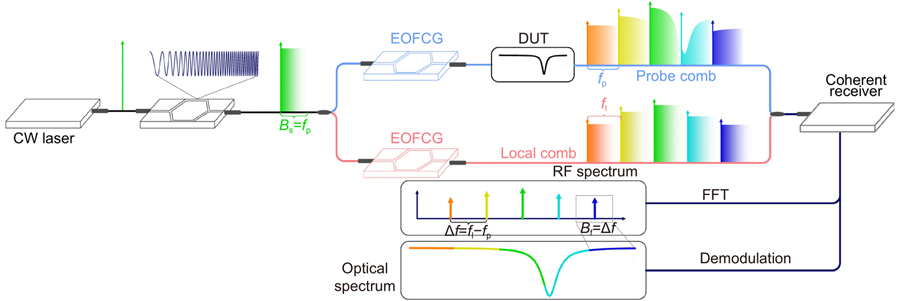
The operation principle is illustrated in Fig. 1. This method consists of two primary components, which are respectively an ultra-linearly frequency-swept optical source generation system and an electro-optic dual-comb interferometer (EO-DCI) system. A continuous wave (CW) laser is externally modulated to generate the swept optical source. The RF driving signal is a sweeping signal with a frequency of µ(t) = γt (0 ≤ t ≤T0), where γ is the frequency sweep rate, and T0 is the sweep time. The generated optical source with Bs = γT0 sweep range may have good sweep nonlinearity and fast sweep rate thanks to the use of programmable RF signal with low phase noise, which contributes to the high resolution spectroscopy and the fast measurement speed.

Figure 1.The schematic to show the operation principle of proposed EO-DCS with real-time interleaved spectrum. CW laser: continuous-wave laser; EOFCG: electro-optic frequency comb generation; DUT: device under test; RF: radio frequency; FFT: fast Fourier transformation.
The probe and local combs with line-spacings of fp and fl are generated with small detuning ∆f = fp− fl in the EO-DCI seeded by the swept source. Each comb-line frequency of the probe comb may be expressed as fpm= fc+ mfp+ γt, where fc is the center frequency and m is the index of comb number. The spectrum of the device under test (DUT) is recorded by the probe comb. Since the probe comb is swept, each comb line measures a bandwidth of Bs instead of a single point in conventional DCS system. The measurement results may be spliced to cover the whole bandwidth of the probe comb when fp ≤ Bs. The interleaved spectrum may reach a resolution limited by the optical sweep nonlinearity. The local comb is simultaneously swept (the m-th line frequency is flm = fc + mfl + γt), so the probe comb lines are separately located to RF domain at the frequencies of m∆f, similar as the principle of conventional DCS.
The spectrum recorded to discrete channels at different RF frequencies may be retrieved by using a digital filter. Relatively, the temporal resolution of each channel is limited by the filter bandwidth to tr = 1/Bf, where Bf ≤ ∆f is the available filter bandwidth. Therefore, for each filtered channel, the spectral resolution may be the product of sweep rate and temporal resolution as fr = trγ = Bs/BfT0 ≥ fp/∆fT0, which illustrates a trade-off between spectral resolution and measurement time. With proper frequency relation, DCS may fully utilize the detection bandwidth under the Nyquist limitation as SAD/2 = K∆f, where K is the number of comb line, and SAD is the sampling rate of ADC. Similarly, the proposed method also makes full use of detection bandwidth, and records Kfp/fr spectral points in T0 time. The spectral sampling rate Ssp (defined as recorded spectral points per unit time) may reach half of ADC sampling rate under Nyquist limitation, expressed as Ssp = Kfp/frT0 ≤K∆f =SAD/2.
In practical experiments, since the nonlinear error of swept source ∆µ determines the frequency accuracy of each spectral point, the limitation of the spectral resolution may be expressed as max (fp/∆fT0, ∆µ). Besides, a narrow filter bandwidth Bf may increase the time domain SNR at the cost of spectral resolution. The user-defined filter bandwidth in demodulation provides flexibility for different applications.
Experimental setup
A specific experimental setup of the DCS system is depicted in Fig. 2. A CW fiber laser (NKT, Adjustik E15) is locked to a stable Fabry-Perot cavity (Stable Laser System) with finesse of 400 k by using Pound-Drever-Hall technique. The stabilized laser operates at the wavelength of 1550.531 nm (or 193.348 THz in optical frequency) with a daily drift of less than 100 kHz, which provides the absolute optical frequency reference. The output of the stabilized laser is modulated by a Mach-Zehnder modulator (MZM), which is driven by an arbitrary waveform generator (AWG, Keysight M8195A) with a sampling rate of 64 GS/s. The electrically driven RF signal is a sinusoidal signal with a frequency swept from 2 GHz to 18 GHz in 1.6 ms. The linearly-swept sideband is generated after the modulation, and then injected into an isolator-removed distributed feedback laser diode (DFB-LD) which serves as a slave laser via an optical circulator. Due to the injection locking effect43, the 1st-order positive sideband is selected and amplified to 10 mW, in which the carrier and all other sidebands are suppressed. Therefore, a swept lightwave with low power fluctuation and low nonlinear error is generated.
Figure 2.Experimental setup of the proposed EO-DCS system. FL: fiber laser; MZM: Mach-Zehnder modulator; AWG: arbitrary waveform generator; AOM: acousto-optic modulator; DDMZM: dual-drive Mach-Zehnder modulator; DUT: device under test; BPD: balanced photodetector.
Then, the swept lightwave is used as the light source of the electro-optic dual-comb interferometer. Two dual-drive MZMs (DD-MZMs) with low half-wave voltage (2.5 V at 25 GHz) are used to generate the probe and local EOFCs with line spacing of fp=16 GHz and fl=15.99 GHz with a detuning ∆f of 10 MHz. The electrical signals generated by RF microwave sources are separated in parallel to be amplified to 3 W to drive the modulators. Then the high-order sidebands are generated and flattened by adjusting the phase shift and the current bias to satisfy the flat spectrum conditions30. An acousto-optic modulator (AOM) introduces a frequency shiftfAOM=200 MHz in the local branch to avoid the overlapping between the positive and negative sidebands. The probe EOFC passes through a DUT and then interferes with the local EOFC. A reference branch without samples is introduced to compensate the power unevenness of each comb line and the power fluctuation during the frequency sweeping. The interference signals are detected by a balanced photo-detector (BPD, Thorlabs PDB470C) with a bandwidth of 400 MHz to be an electrical RF comb with a line-spacing of ∆f, and digitized by a digital oscilloscope (OSC, Keysight DSOS204A) with a sampling rate of 1 GS/s. The RF generators and the OSC are synchronous to a same 10 MHz oscillator generated from an atomic clock, which maintains the mutual coherence between two EOFCs.
Results
Fast measurement in 1.6 ms
As shown in Fig. 3(a), we characterize the property of the swept lightwave by using an unbalanced Mach-Zehnder interferometer41. The length of delay fiber is 200 m, and the unwrapped phase φ of the beat frequency is used to calculate instantaneous frequency fi based on the equation of fi = c∆φ/2πnL , where c is the velocity of light and n is refractive index of fiber, to evaluate the sweep nonlinear error. The lightwave sweeps 16 GHz bandwidth in 1.6 ms as shown in Fig. 3(b). The standard deviation of the nonlinear error is calculated to be 9.13 kHz. The optical spectra of the probe comb and local comb, when the seed lightwave is not swept, are shown in Fig. 3(c) and 3(d), which are measured by using an optical spectrometer with 2 GHz resolution. Each comb contains about 25 comb lines with a flatness of 10 dB. The optical spectrum of the probe comb, when the seed lightwave is swept to cover the gap between adjacent lines, is also shown in Fig. 3(c).
Figure 3.(a) Experiment setup of swept lightwave characterization. (b) Sweep range and nonlinear error of the ultra-linearly swept optical source measured by using an unbalanced Mach-Zehnder interferometer. (c) Optical spectrum of the probe comb with a stabilized optical source and a linearly-swept optical source. (d) Optical spectrum of the local comb with a stabilized optical source.
Temporal data of reference branch recorded in 1.6 ms are shown in Fig. 4(a), which have a relatively stable power thanks to the use of optical injection locking. A zoom-in figure containing four interferograms in 0.4 µs is shown in Fig. 4(b). The non-pulse interferograms may reduce the quantization noise. As depicted in Fig. 4(c), the electrical spectrum is obtained by digital Fourier transformation, which contains 25 flat lines circled by blue dotted line. The slope of both signal and noise powers are introduced by the frequency response of BPD. The center frequency is located at 200 MHz with a small detune introduced by the optical path difference. Each channel is equally spaced with an interval of ∆f=10 MHz to be distinguished in frequency domain.
Figure 4.(a) Temporal waveform of dual-comb interferometer recorded in 1.6 ms with a sampling rate of 1 GS/s. (b) Zoom-in figure of (a) in 0.4 µs. (c) Electrical spectrum of reference branch containing total 25 lines centered at about 200 MHz. (d) Temporal waveform and (e) zoom-in figure of the 3-rd channel obtained by digital filtering. (f) Envelopes of the 3-rd channel for measurement and reference branches obtained by digital Hilbert transformation. Demodulated spectrum without DUT at 1 MHz spectral resolution for (g) the 3-rd channel in 16 GHz bandwidth and (h) all channels covering 400 GHz bandwidth, in which the standard deviation is calculated to be 2.316 %.
A digital filter with a bandwidth of 10 MHz is used to demodulate all lines, and a filtered temporal waveform of the 3-rd channel circled by green dotted line is shown in Fig. 4(d). The waveform is a sinusoidal signal as shown in the zoom-in figure. The varying intensity in 1.6 ms is the power fluctuation and noise, and relatively the varying intensity of the measurement branch represents the recorded optical spectrum of the DUT. The envelope is obtained by a digital Hilbert transformation and then moving averaged with a 100-point window. The temporal resolution is 100 ns corresponding to 10 MHz filter bandwidth. The extracted envelopes of measurement branch without DUT and reference branch are shown in Fig. 4(f). The power fluctuation is eliminated by comparing the results of two branch. The calibrated spectrum in 16 GHz bandwidth is recovered with a spectral resolution of 1 MHz, as shown in Fig. 4(g). After successively demodulating all 25 channels, we obtain the whole spectrum spanning 400 GHz. Since each spectrum with 400 GHz bandwidth and 1 MHz resolution is recorded in 1.6 ms, the equivalent spectral sampling rate reaches 2.5 × 10⁸ points/s, which is half of Nyquist upper limitation (sampling rate of ADC is 1 GS/s) thanks to the real-time interleaving. Figure 4(h) shows the demodulated spectrum without DUT, in which the power differences among comb lines are also eliminated and the SNR differences still exist. The stabilized seed laser and the ultra-linear sweeping ensures the frequency accuracy of the measured spectrum. The standard deviation of the spectrum shown in Fig. 4(h) is calculated to be 2.3169%, which represents the standard deviation of the spectral measurement error σΗ. So the averaged spectral measurement SNR is calculated to be 43.2 by SNR=1/σΗ. The M×SNR is calculated to be 1.73×10⁷ in 1.6 ms, where M is the number of spectral points.
A reflectance spectrum of a fiber Fabry-Perot cavity is measured by the proposed system with a setup shown in Fig. 5(b). The FFPI is composed of a pair of fiber Bragg gratings (FBGs) with a reflectivity of 99%, and the cavity length is 3.3 cm. The reflectance spectrum spanning 400 GHz with 1 MHz resolution are recorded in 1.6 ms and shown in Fig. 5(a). The free spectral range (FSR) of F-P cavity are measured to be 3 GHz. The deepest resonance centered at 1.165 GHz relative frequency is depicted in Fig. 5(c) in linear coordinate. The full width half maximum (FWHM) is about 17 MHz corresponding to a Q-factor of over 107. To validate the measurement result of the proposed method, we also measure the spectrum of this resonance by using ultrafine EOFC (UFEOFC). The experimental setup is shown in Fig. 5(d), similar to that used in ref.42. An UFEOFC with 1 MHz line-spacing is resolved in a self-heterodyne interferometer. The demodulated result with higher SNR is also shown in Fig. 5(c) in red, and the consistency between two results validates the proposed method.
Figure 5.(a) Reflectance spectrum measured in 1.6 ms with 1 MHz resolution. (b) Experimental setup of the fiber F-P cavity with 3 GHz FSR. (c) Measurement results of the deepest resonance with 17 MHz FWHM by using proposed method and ultra-fine EOFC. (d) Experimental setup of UFEOFC-based high resolution spectroscopy for comparison.
High SNR measurement over 30 dB
As described in the part of "Operation principles" section, an exchange between spectral resolution and time domain SNR may be realized by adjusting the bandwidth of the digital filter. According to the demodulation process, time domain SNR determines the spectral measurement SNR, therefore a narrow bandwidth filter may be used to realize high SNR measurement of relatively wide spectral resonances such as gas absorption.
A transmission spectrum of a H13CN gas cell is measured by using the same experimental setup. The single pass cell has a length of 15 cm at 25 Torr (1 Torr = 133.322 Pa, Wavelength References, HCN-13-25) under a laboratory temperature of about 297 K. To improve the SNR, we set filter bandwidth to be 200 kHz in demodulation, corresponding to a temporal resolution of 5 µs and a spectral resolution of 50 MHz. A single-shot spectroscopic result centered at 193.348 THz is shown in Fig. 6(a), containing the absorption lines of P9–13 in the 2v3 band. A 25 times averaged result for further SNR improvement is also shown in Fig. 6(b). Zoom-in figures of the P11 line are shown in Fig. 6(c), together with fitting curve based on the Voigt function for comparison. The residual errors between the results and fitting curve are shown in Fig. 6(d), which represent the spectral measurement error. The standard deviations σΗ are respectively 0.378% and 0.087% for the single-shot measurement and 25-averaged measurement, and the spectral measurement SNR may be also calculated by SNR=1/σΗ. The SNR of 50-MHz resolution single-shot measurement is calculated to be 264.6, which proves the validity of SNR improvement by digital filter bandwidth reduction similar as mode-filtering in DCS. Besides, with 25 times averaging, the SNR reaches 1148.2 (corresponding to 30.6 dB) in 50 ms.
Figure 6.Spectra of H13CN gas cell obtained by (a) single-shot measurement and (b) 25 times averaged measurement, containing the absorption lines of P9-13 in the 2v3 band. (c) Measurement results and Voigt fitting curve of the P11 line. (d) Residual errors between the measurement results and fitting curve, and the standard deviations are calculated to be 0.378% and 0.087% for the single-shot measurement and 25-averaged measurement. The spectral resolution is 50 MHz by reducing the filter bandwidth to 200 kHz.
Ultrahigh resolution of 20 kHz
In above experiments, 1 MHz resolution are limited by 1.6 ms sweep time. To reach the tens of kHz spectral resolution limitation caused by the sweep nonlinearity, we increase the sweep time to 90 ms covering a range of 18 GHz. The swept lightwave is also characterized by the unbalanced Mach-Zehnder interferometer shown in Fig. 3(a). The unwrapped phase of the beat frequency has three hopping circled in Fig. 7(a), since the RF signal may not be swept continuously at that time. The nonlinear error from 20 ms to 90 ms is shown in the zoom-in figure, and the standard deviation is calculated to be 17 kHz. The line spacing of the probe and local comb are also set to be 18 GHz and 17.99 GHz corresponding to the sweep range. Other setups are same as those used in the experiments described in “Experimental setup” section. We measured the reflectance spectrum of another fiber F-P cavity with a cavity length of 18.9 cm. The electrical spectrum obtained by FFT for the measurement branch is shown in Fig. 7(b). Considering the reflection region, six channels circled in blue are demodulated. The filter bandwidth is 10 MHz, corresponding to a temporal resolution of 100 ns. The spectral resolution is 20 kHz, and the demodulated spectrum in 108 GHz bandwidth with 20 kHz resolution is shown in Fig. 7(d). Here, the points during the phase hopping circled in red are removed, which may lose the spectrum of few resonances. The electrical spectrum of the reference branch shown in Fig. 7(c) illustrates at least 23 channel results are simultaneously recorded in 414 GHz bandwidth. Totally, 20.125 million spectral points are measured in 90 ms, corresponding to a spectral sampling rate of 2.24 ×10⁸ points/s. A zoom-in figure of the circled resonance in Fig. 7(d) is shown in Fig. 7(e) in linear coordinate. This resonance is also measured by using UFEOFC with 20 kHz line-spacing with the usage of the same setup shown in Fig. 5(d). The measurement results by the two methods are shown in Fig. 7(e). The SNR is relatively low comparing to the method of using UFEOFC as the proposed method provides a wider bandwidth. However, it may also characterize the narrow resonance whose FWHM is measured to be about 600 kHz as the Q-factor of the cavity is over 3×10⁸.
Figure 7.(a) Unwrapped phase and nonlinear error of the swept optical source with 18 GHz sweep range and 90 ms sweep time. Electrical spectrum of (b) measurement branch and (c) reference branch, in which six lines circled are demodulated. (d) Demodulated reflectance spectrum of a fiber F-P cavity with 20 kHz spectral resolution. The points during the phase hopping circled in red are removed. (e) A resonance with 600 kHz FWHM measured by using the proposed method and UFEOFC.
Discussion and conclusions
We have proposed a novel interleaving DCS technique with 0.16 fm (or 20 kHz) spectral resolution, which is three orders of magnitude narrower than existing demonstrations. Stabilized seed laser provides absolute optical frequency reference without additional calibration, and then external modulated to generate sweeping lightwave. Electrical driving signal with low nonlinearity error is fully utilized for ultra-high resolution and fast measurement. 20.125 million spectral points are recorded in 90 ms spanning 3.2 nm (or 400 GHz) bandwidth.
Theoretical performance limitation of interleaving DCS is analyzed and illustrated to reach the Nyquist-limitation. This significant superiority of DCS has not been considered in previous interleaving DCS. Spectral sampling rate, as a normalized factor to characterize overall performance, reaches 2.5×10⁸ points/s to be half of Nyquist-limitation. Based on the theoretical trade-off between sweep time and spectral resolution, a fast measurement may be realized in 1.6 ms. The refresh rate of 625 Hz is fastest in interleaving DCS, which is also remarkable for all existing DCS considering the resolution of 1 MHz and bandwidth of 400 GHz. The reflectance spectrum of high Q-factor (over 108) fiber Fabry-Perot cavity demodulated in the proposed method is also measured by the ultra-fine EOFC to validate the performance. Flexible filter bandwidth adjustment in demodulation enables high SNR measurement of H13CN gas cell at the cost of resolution. The SNR reaches 30.6 dB after averaging in 50 ms with a spectral resolution of 50 MHz. This paper provides an effective method based on EOFCs for sub-fm-resolution absolute spectroscopy. Together with flexible fast refresh time and high SNR, the proposed method may be implemented in various applications including measuring high-Q cavity, electro-magnetically induced transparency, or physical and biochemical sensing requiring hyperfine spectrum measurement, and high sensitivity implementations such as green gas monitoring.
References
[35] Jacquet P, Mandon J, Bernhardt B, Holzwarth R, Guelachvili G et al. Frequency comb Fourier transform spectroscopy with KHz optical resolution. In Fourier Transform Spectroscopy 2009 (Optical Society of America, 2009); https://doi.org/10.1364/FTS.2009.FMB2.
[39] Nishikawa T, Oohara A, Uda S, Ishizawa A, Hitachi K et al. Automatic interpolation of 25 GHz mode spacing in dual EOM comb spectroscopy. In 2019Conference on Lasers and Electro-Optics 1–2 (IEEE, 2019);http://doi.org/10.1364/CLEO_SI.2019.SF1I.3.