• Acta Physica Sinica
  • Vol. 69, Issue 9, 090701-1 (2020)
Feng-Yang Wang1、2, Ren-Zhi Hu1、*, Pin-Hua Xie1、2、3、4、*, Yi-Hui Wang1、2, Hao Chen5, Guo-Xian Zhang1、2, and Wen-Qing Liu1、2、3、4
Author Affiliations
  • 1Key Laboratory of Environmental Optics and Technology, Anhui Institute of Optics and Fine Mechanics, Chinese Academy of Sciences, Hefei 230031, China
  • 2University of Science and Technology of China, Hefei 230026, China
  • 3CAS Center for Excellence in Regional Atmospheric Environment, Institute of Urban Environment, Chinese Academy of Sciences, Xiamen 361000, China
  • 4University of Chinese Academy of Sciences, Beijing 100049, China
  • 5College of Mechanical Engineering, Suzhou University of Science and Technology, Suzhou 215009, China
  • show less
    DOI: 10.7498/aps.69.20200153 Cite this Article
    Feng-Yang Wang, Ren-Zhi Hu, Pin-Hua Xie, Yi-Hui Wang, Hao Chen, Guo-Xian Zhang, Wen-Qing Liu. Calibration source for OH radical based on synchronous photolysis[J]. Acta Physica Sinica, 2020, 69(9): 090701-1 Copy Citation Text show less
    Schematic diagram of laminar distribution in the flow tube
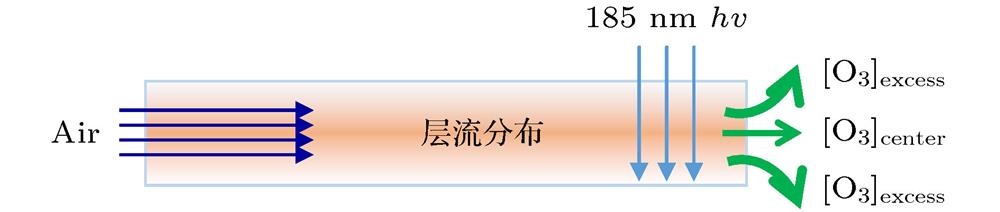
    Fig. 1. Schematic diagram of laminar distribution in the flow tube
    System diagram of synchronous photolysis of H2O and O2.
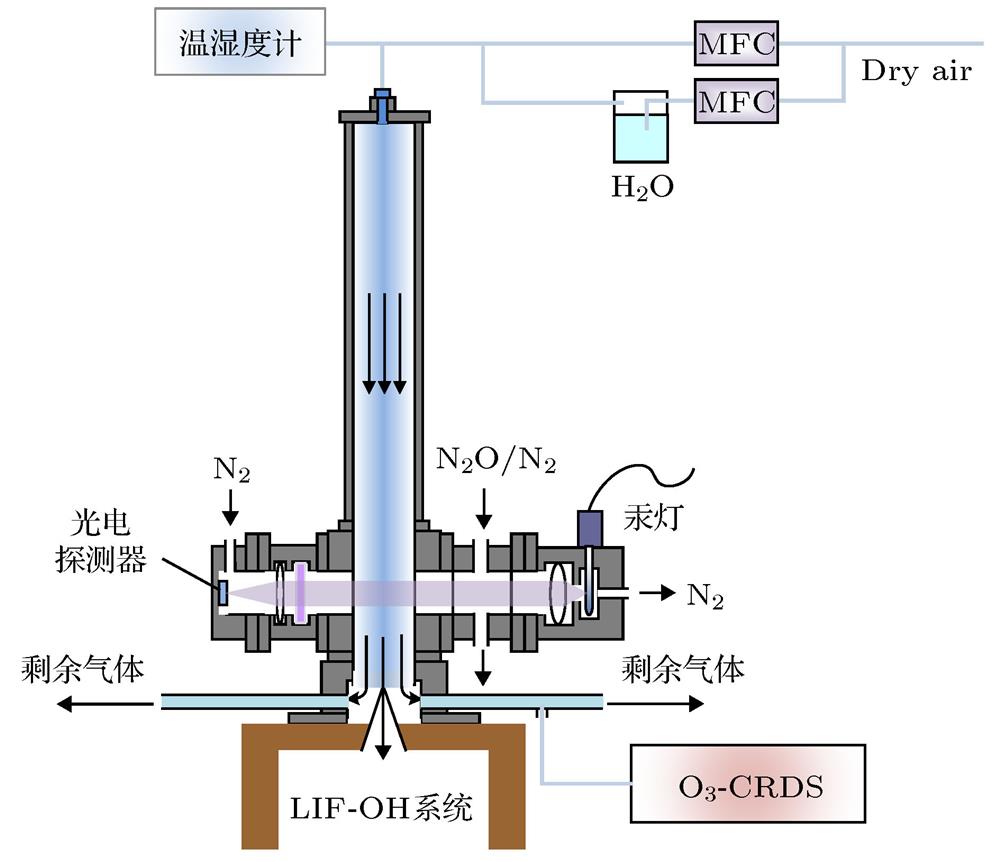
    Fig. 2. System diagram of synchronous photolysis of H2O and O2.
    Schematic diagram of O3-CRDS.
    Fig. 3. Schematic diagram of O3-CRDS.
    (a) When the instrument only samples zero air, the black point represents the average data of 1 s, and the red point represents the average data of 30 s; (b) Allan variance of ozone concentration.
    Fig. 4. (a) When the instrument only samples zero air, the black point represents the average data of 1 s, and the red point represents the average data of 30 s; (b) Allan variance of ozone concentration.
    Measurement results of ozone concentration distribution factor P.
    Fig. 5. Measurement results of ozone concentration distribution factor P.
    (a) Light intensity at 185 nm as a function of N2O concentration; (b) relationship between light intensity and ozone concentration.
    Fig. 6. (a) Light intensity at 185 nm as a function of N2O concentration; (b) relationship between light intensity and ozone concentration.
    Concentration of OH radicals produced by the calibration device corresponds to the fluorescence count of LIF-OH system.
    Fig. 7. Concentration of OH radicals produced by the calibration device corresponds to the fluorescence count of LIF-OH system.
    Calibration results of LIF-OH instrument by OH radical calibration source under field conditions.
    Fig. 8. Calibration results of LIF-OH instrument by OH radical calibration source under field conditions.
    误差源不确定度来源
    臭氧分布系数P6.0%测量
    臭氧灵敏度Qv2.9%测量
    PD光强 I'1.0%测量
    水汽浓度[H2O] 2.0%测量
    氧气吸收截面 $ \sigma _{\rm O_2} $7.0%测量
    水汽吸收截面 $ {\sigma _{{{\rm{H}}_2}{\rm{O}}}} $3.0%引用
    标定装置产生OH自由基误差10.4%计算
    Table 1.

    Uncertainty of OH radical calibration source.

    OH自由基标定装置不确定度

    Feng-Yang Wang, Ren-Zhi Hu, Pin-Hua Xie, Yi-Hui Wang, Hao Chen, Guo-Xian Zhang, Wen-Qing Liu. Calibration source for OH radical based on synchronous photolysis[J]. Acta Physica Sinica, 2020, 69(9): 090701-1
    Download Citation