
Chun-Yan Sun, Gui-Shi Wang, Gong-Dong Zhu, Tu Tan, Kun Liu, Xiao-Ming Gao. Atmospheric CO2 column concentration retrieval based on high resolution laser heterodyne spectra and evaluation method of system measuring error [J]. Acta Physica Sinica, 2020, 69(14): 144201-1
- Acta Physica Sinica
- Vol. 69, Issue 14, 144201-1 (2020)
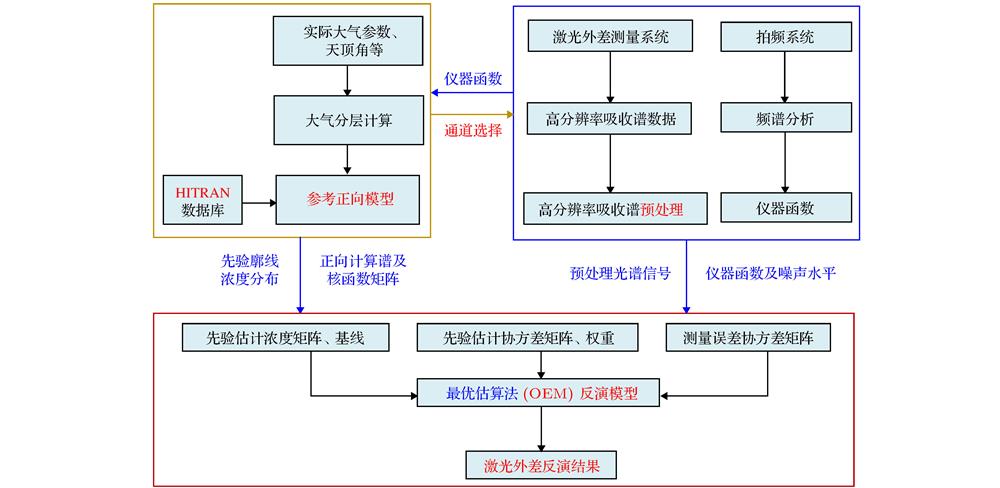
Fig. 1. Overall technical route of laser heterodyne system.
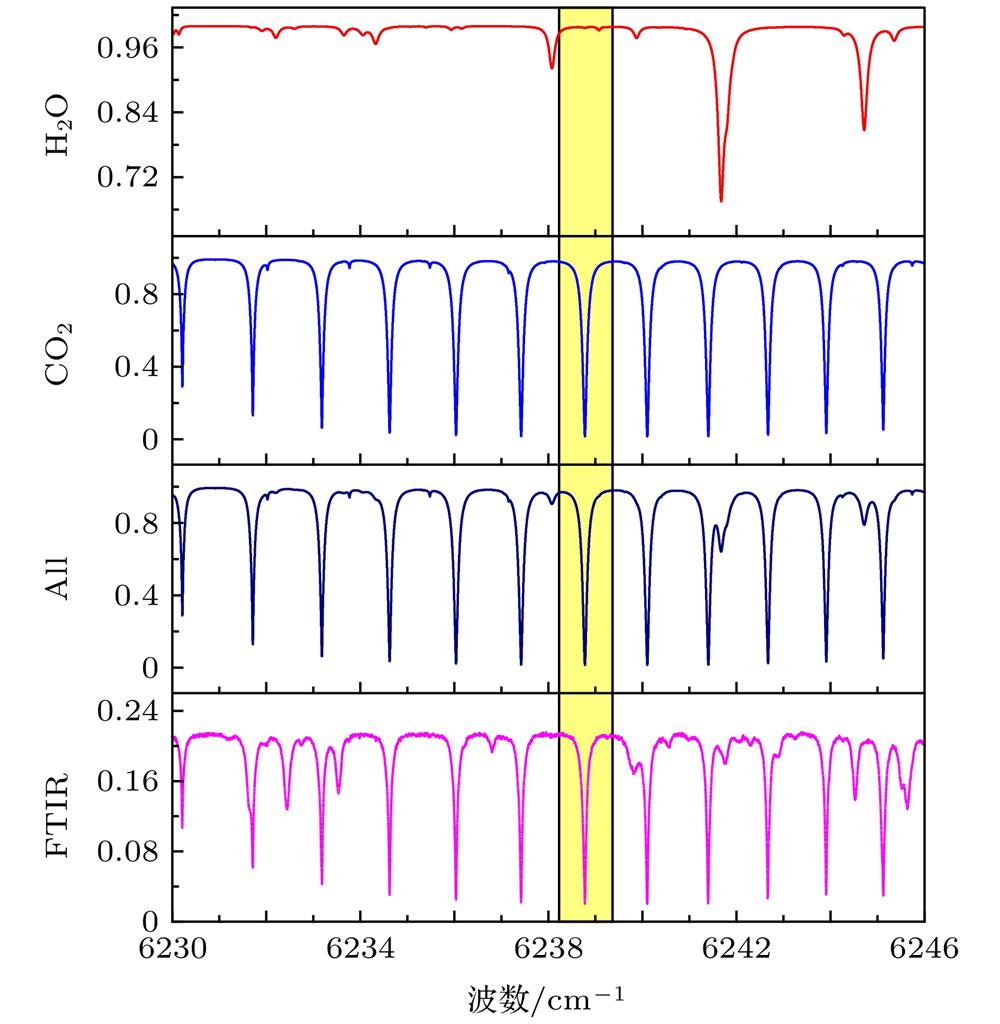
Fig. 2. Forward transmittance spectrum based on RFM simulation and selected detection window.
Fig. 3. Experimental results of the laser heterodyne: (a) The high-resolution heterodyne signal of CO2; (b) the sunlight signal tracked in real time; (c) the DC signal of the laser.
Fig. 4. Principle of the wavenumber shift calibration: (a) Wavenumber shift between the reference signal and real signal; (b) the process of calculating the wavenumber shift. The inset shows the result of correlation coefficients.
Fig. 5. (a) Temperature and (b) pressure profiles.
Fig. 6. Data inversion flow chart. VMR, volume mixing ratio; ILS, instrument linear; LM, Levenberg–Marquardt.
Fig. 7. Inversion results of LHR data: (a) Experimental and fitted LHR spectrogram and convergence of iterative process (illustration); (b) residue; (c) and (d) obtained prior and inversion vertical concentration profiles of CO2, respectively.
Fig. 8. (a) Retrieval results of the
 versus time from 11:00 to 13:00 on March 14, 2019; (b) time series of the LHR results and GOSAT results of
 .
.
versus time from 11:00 to 13:00 on March 14, 2019; (b) time series of the LHR results and GOSAT results of
. Fig. 9. (a) The transmittance spectrum after adding white noise with the amplitude of 0.05; (b) change range of the lowest point of transmittance spectrum after adding 5000 times.
Fig. 10. Changes of
 , Max, Min, and SNR caused by the white noise amplitude increasing from 0.001 to 0.050.
, Max, Min, and SNR caused by the white noise amplitude increasing from 0.001 to 0.050. Fig. 11. (a) The relationship between the minimum value and the change of profile; (b) the relationship between the change of column total and the minimum.
Fig. 12. The relationship between SNR and measurement error.
|
Table 1.
Definition of the state vector used in the data retrieval.
数据反演中使用的状态向量的定义

Set citation alerts for the article
Please enter your email address
© Copyright 2018-2021 | Chinese Laser Press. All Rights Reserved 沪ICP备15018463号-20