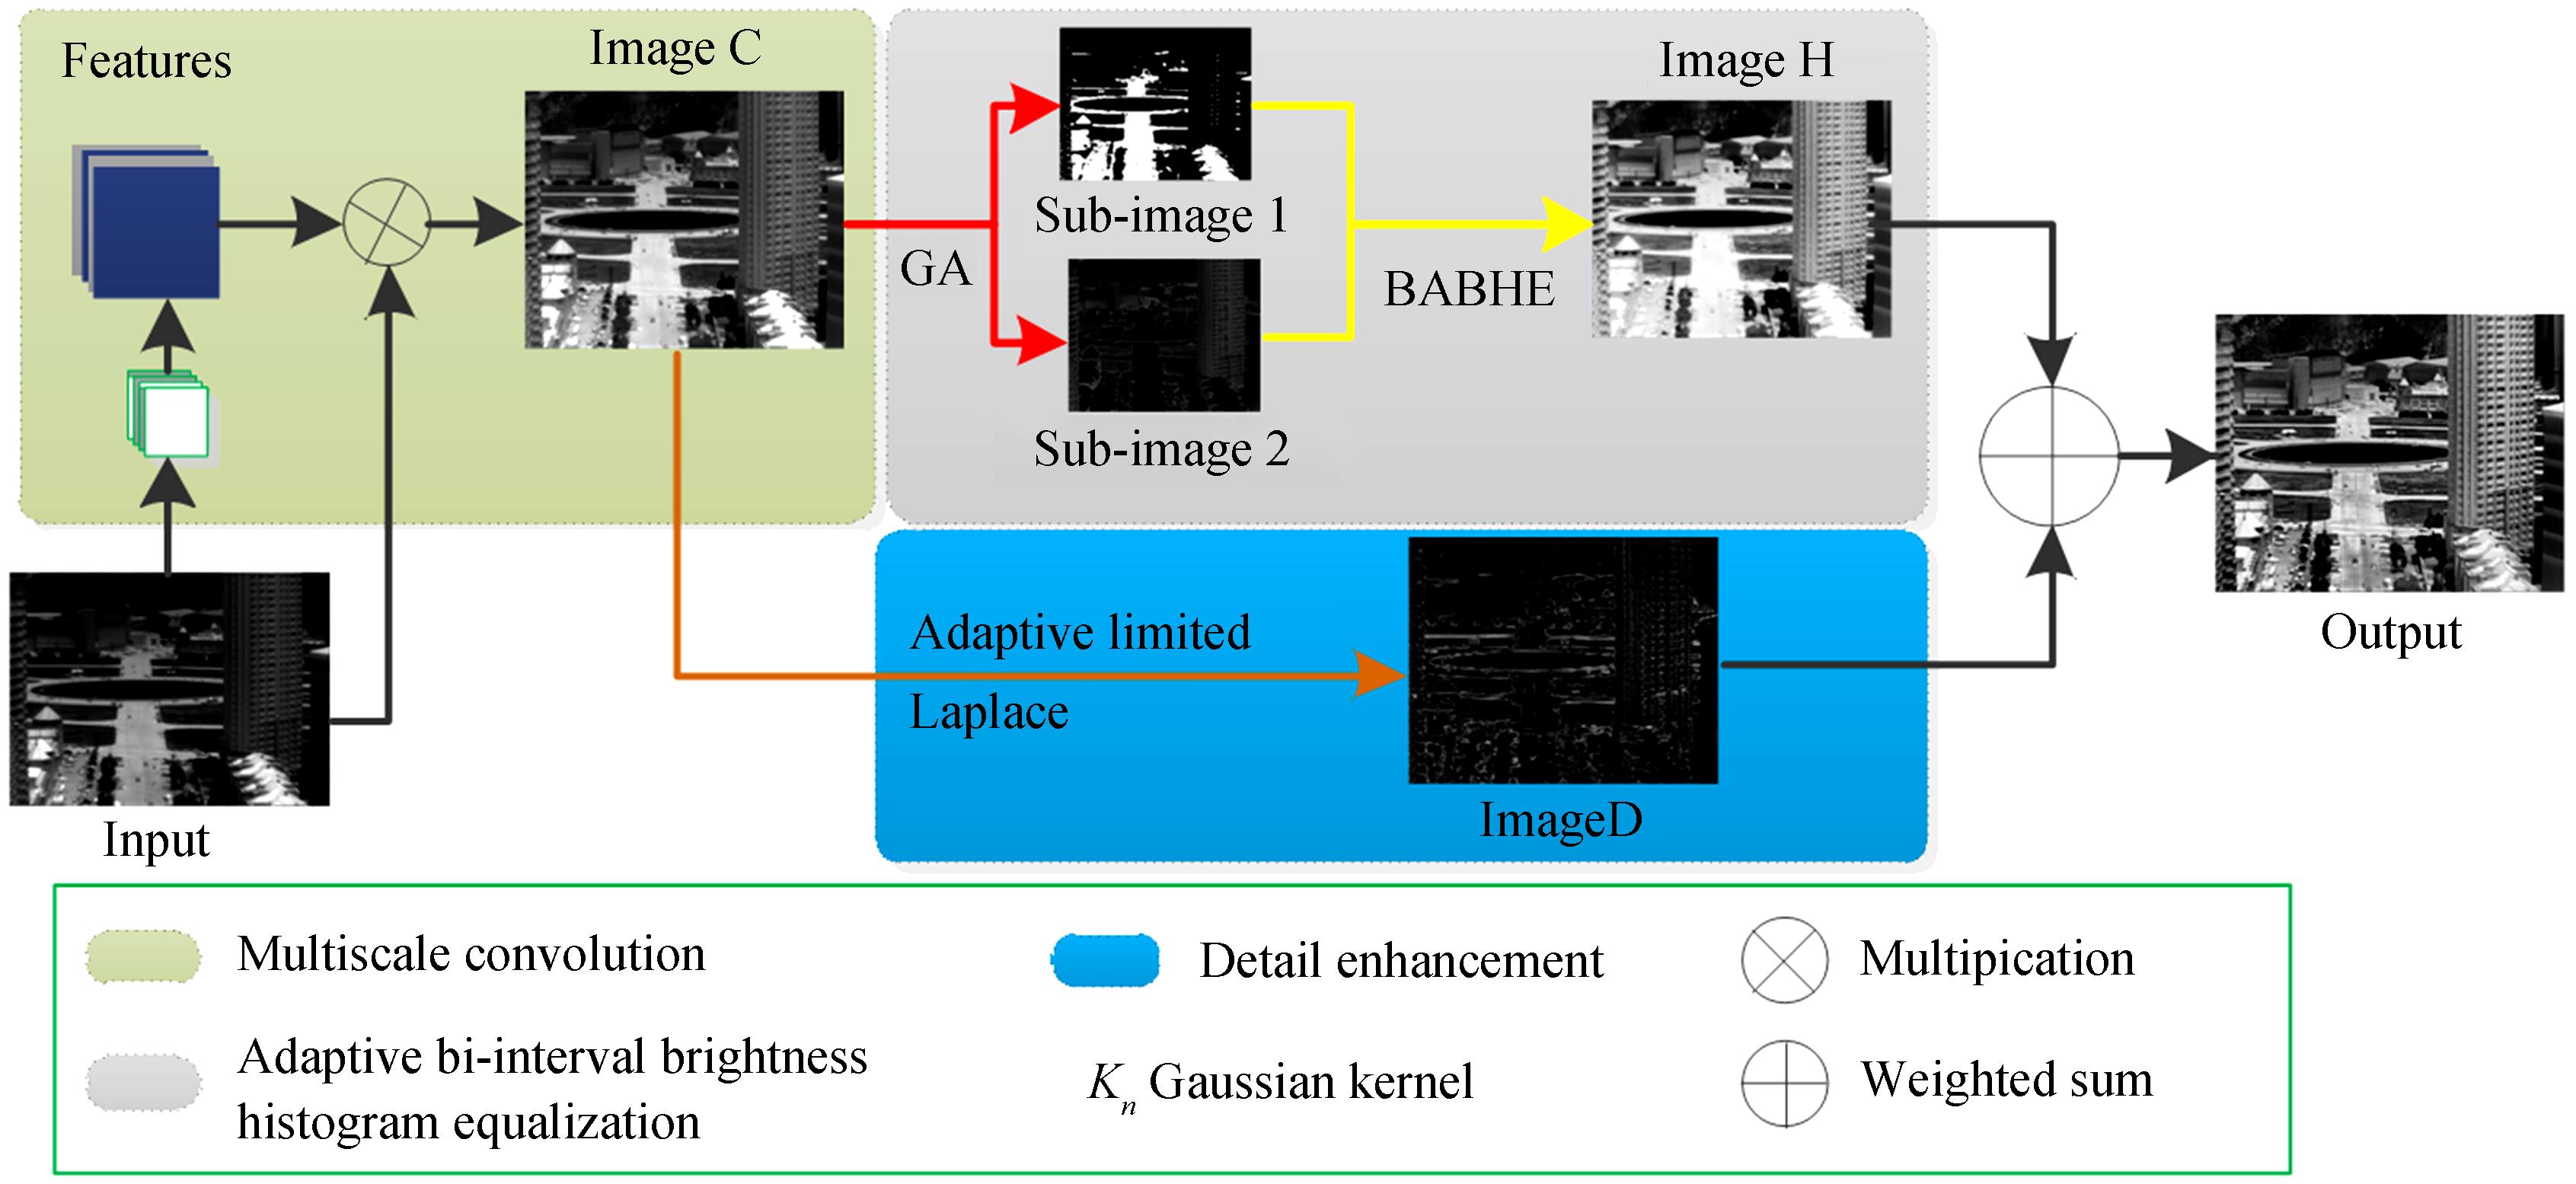
Fig. 1. Algorithm flow
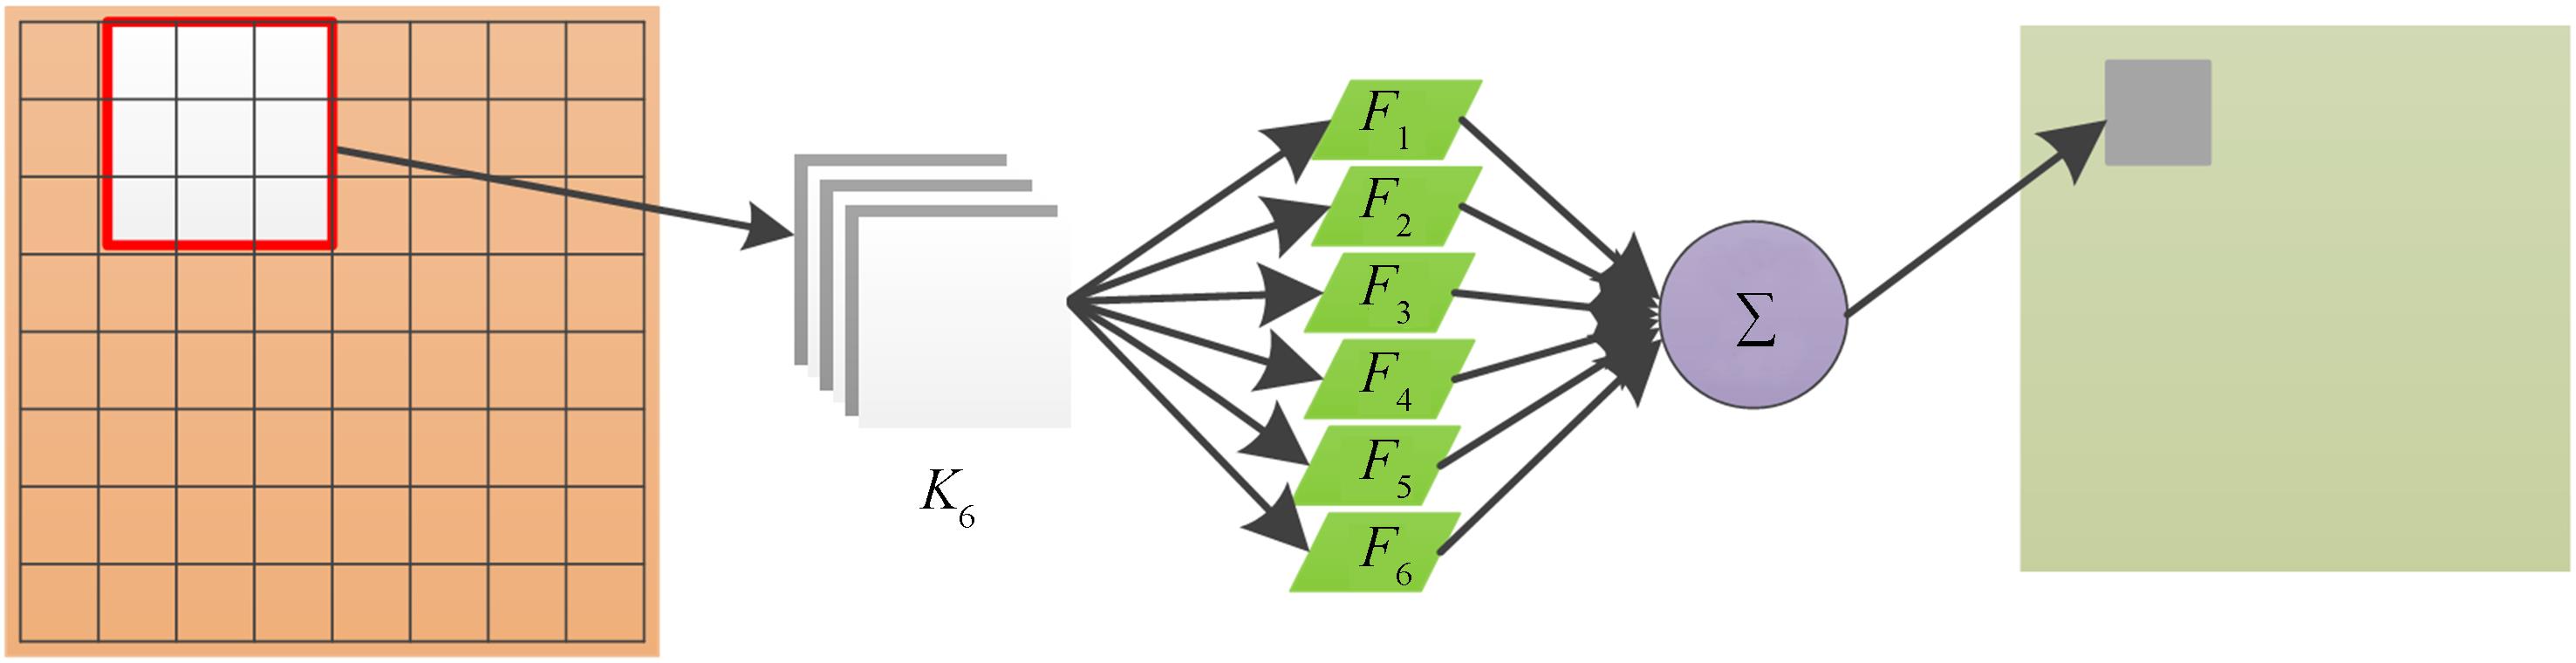
Fig. 2. Multi-scale convolution extraction process of image details
Fig. 3. The process of solving threshold values by genetic algorithm
Fig. 4. Image fusion result with different β
Fig. 5. Original infrared images of building, enhancement results by different methods and their histograms
Fig. 6. The enhancement effect and local detail image of the infrared images of building
Fig. 7. Image fusion result with different λ
Fig. 8. The enhancement effect of different algorithms
Fig. 9. The enhancement effect of different algorithms
Fig. 10. The enhancement image of different algorithms
Fig. 11. Comparison of image enhancement effects by the method in this paper
| Kernels | Scales | En | EPI | Time |
|---|
| 3 | 0.1, 0.5, 1 | 5.63 | 4.20 | 0.28 | | 6 | 0.1, 0.3, 0.5, 0.7, 0.9, 1 | 6.39 | 4.96 | 0.53 | | 9 | 0.1, 0.2, 0.3, 0.4, 0.5, 0.6, 0.7, 0.9, 1 | 6.41 | 5.01 | 0.81 |
|
Table 1. Running time of MSC with different parameters and En、EPI of images processed by MSC
| AG | EME | En |
|---|
| 0 | 3.435 3 | 4.369 8 | 5.360 3 | | 0.1 | 3.436 8 | 4.370 0 | 5.444 5 | | 0.2 | 3.444 0 | 4.421 2 | 5.598 6 | | 0.3 | 3.685 0 | 4.632 8 | 5.685 6 | | 0.4 | 4.232 0 | 5.002 1 | 6.002 3 | | 0.5 | 4.498 5 | 5.332 3 | 6.112 3 | | 0.6 | 4.902 1 | 5.952 0 | 6.399 8 | | 0.7 | 5.253 6 | 6.232 9 | 6.860 0 | | 0.8 | 6.360 2 | 7.033 4 | 7.368 8 | | 0.9 | 4.553 6 | 5.369 8 | 6.998 5 | | 1 | 4.033 2 | 5.332 0 | 6.523 0 |
|
Table 2. AG, EME, and En of enhanced images by BABHE with different
| Image | Evaluation index | Original | BBHE | HEEF | DOTHE | RLBHE | FCCE | Wan | Our |
|---|
| Image A | EME | 5.219 7 | 6.959 3 | 12.022 9 | 8.069 1 | 3.893 2 | 7.998 5 | 2.144 6 | 15.139 1 | | En | 7.071 1 | 7.293 5 | 6.773 2 | 7.639 2 | 6.526 1 | 7.117 2 | 6.839 9 | 7.846 8 | | AG | 3.586 3 | 5.154 7 | 6.296 3 | 6.398 6 | 2.531 5 | 3.999 7 | 3.685 3 | 13.718 8 | | t | - | 0.632 5 | 0.017 8 | 11.176 6 | 0.867 2 | 0.423 0 | 58.029 5 | 16.536 5 | | Image B | EME | 1.457 2 | 8.454 9 | 3.477 8 | 9.195 0 | 2.856 0 | 7.222 9 | 0.951 0 | 13.466 6 | | En | 5.820 8 | 7.642 5 | 5.690 6 | 7.655 7 | 6.614 2 | 7.535 8 | 5.857 8 | 7.525 4 | | AG | 2.415 9 | 9.283 0 | 4.529 0 | 8.876 2 | 4.833 9 | 8.196 0 | 2.467 7 | 15.863 7 | | t | - | 0.510 3 | 0.012 9 | 12.364 4 | 0.908 0 | 0.392 1 | 56.983 3 | 16.145 2 | | Image C | EME | 1.832 2 | 6.415 3 | 2.024 7 | 5.273 4 | 1.816 7 | 1.655 3 | 1.133 2 | 7.067 9 | | En | 5.039 1 | 7.523 9 | 3.857 2 | 7.856 0 | 6.144 5 | 5.768 3 | 5.533 6 | 7.163 3 | | AG | 1.142 6 | 6.099 0 | 0.740 0 | 7.864 3 | 2.433 2 | 5.363 9 | 1.337 5 | 11.988 4 | | t | - | 0.600 2 | 0.150 4 | 16.010 4 | 1.017 2 | 0.446 8 | 52.362 3 | 16.688 0 | | Image D | EME | 3.178 9 | 8.685 8 | 9.287 2 | 7.347 4 | 3.094 6 | 2.095 5 | 0.941 0 | 17.322 8 | | En | 5.468 1 | 6.895 0 | 5.317 3 | 7.634 1 | 5.589 2 | 5.874 1 | 5.409 6 | 7.290 4 | | AG | 1.782 0 | 5.341 9 | 4.156 7 | 5.709 2 | 1.243 6 | 2.104 9 | 2.203 5 | 13.991 8 | | t | - | 0.663 5 | 0.018 5 | 14.450 0 | 1.106 0 | 0.432 0 | 61.036 5 | 14.064 7 | | Image E | EME | 0.821 4 | 7.209 9 | 2.063 2 | 6.452 3 | 2.391 0 | 4.575 7 | 0.767 1 | 12.594 9 | | En | 5.425 6 | 6.766 1 | 5.250 1 | 7.762 5 | 6.617 1 | 7.650 5 | 7.310 3 | 7.809 1 | | AG | 1.001 5 | 3.088 8 | 2.021 9 | 6.523 1 | 2.442 5 | 5.435 4 | 4.785 2 | 11.516 9 | | t | - | 0.234 5 | 0.011 2 | 9.972 4 | 0.869 3 | 0.274 0 | 58.258 0 | 10.694 6 | | Image F | EME | 13.446 1 | 23.586 9 | 75.901 7 | 32.311 5 | 23.540 1 | 26.066 4 | 4.360 1 | 90.252 5 | | En | 6.587 4 | 7.014 2 | 6.321 8 | 7.306 8 | 6.409 3 | 7.403 0 | 6.331 5 | 7.540 3 | | AG | 7.845 0 | 9.748 9 | 22.313 3 | 19.900 7 | 11.317 3 | 14.236 5 | 6.889 9 | 53.617 7 | | t | - | 0.223 5 | 0.006 6 | 7.011 6 | 0.678 6 | 0.139 8 | 22.406 9 | 6.303 9 |
|
Table 4. Running time of different algorithms and EME, En and AG of processed image by different algorithms
| Original image | HEEF | BBHE | BABHE |
|---|
| Average grays | 57 | 46 | 68 | 88 | | Number of gray levels | 232 | 254 | 256 | 256 | | En | 6.635 7 | 6.554 3 | 7.272 4 | 7.368 8 |
|
Table 4. Objective evaluation of image quality after enhancement processing by each algorithm
| Input | MSC/s | BABHE/s | ALL/s | LF/s |
|---|
| Image A | 0.615 9 | 15.485 4 | 0.058 7 | 0.376 5 | | Image B | 0.577 8 | 15.504 4 | 0.060 3 | 0.001 3 | | Image C | 0.553 3 | 16.032 5 | 0.068 5 | 0.033 6 | | Image D | 0.602 3 | 13.336 2 | 0.060 3 | 0.065 9 | | Image E | 0.583 8 | 10.048 2 | 0.061 7 | 0.000 9 | | Image F | 0.360 3 | 5.881 6 | 0.061 4 | 0.000 6 |
|
Table 5. Running time of each stage of the algorithm in this paper