
Sha Sha, Huan-Hao Zhang, Zhi-Hua Chen, Chun Zheng, Wei-Tao Wu, Qi-Chen Shi. Mechanism of longitudinal magnetic field suppressed Richtmyer-Meshkov instability [J]. Acta Physica Sinica, 2020, 69(18): 184701-1
- Acta Physica Sinica
- Vol. 69, Issue 18, 184701-1 (2020)
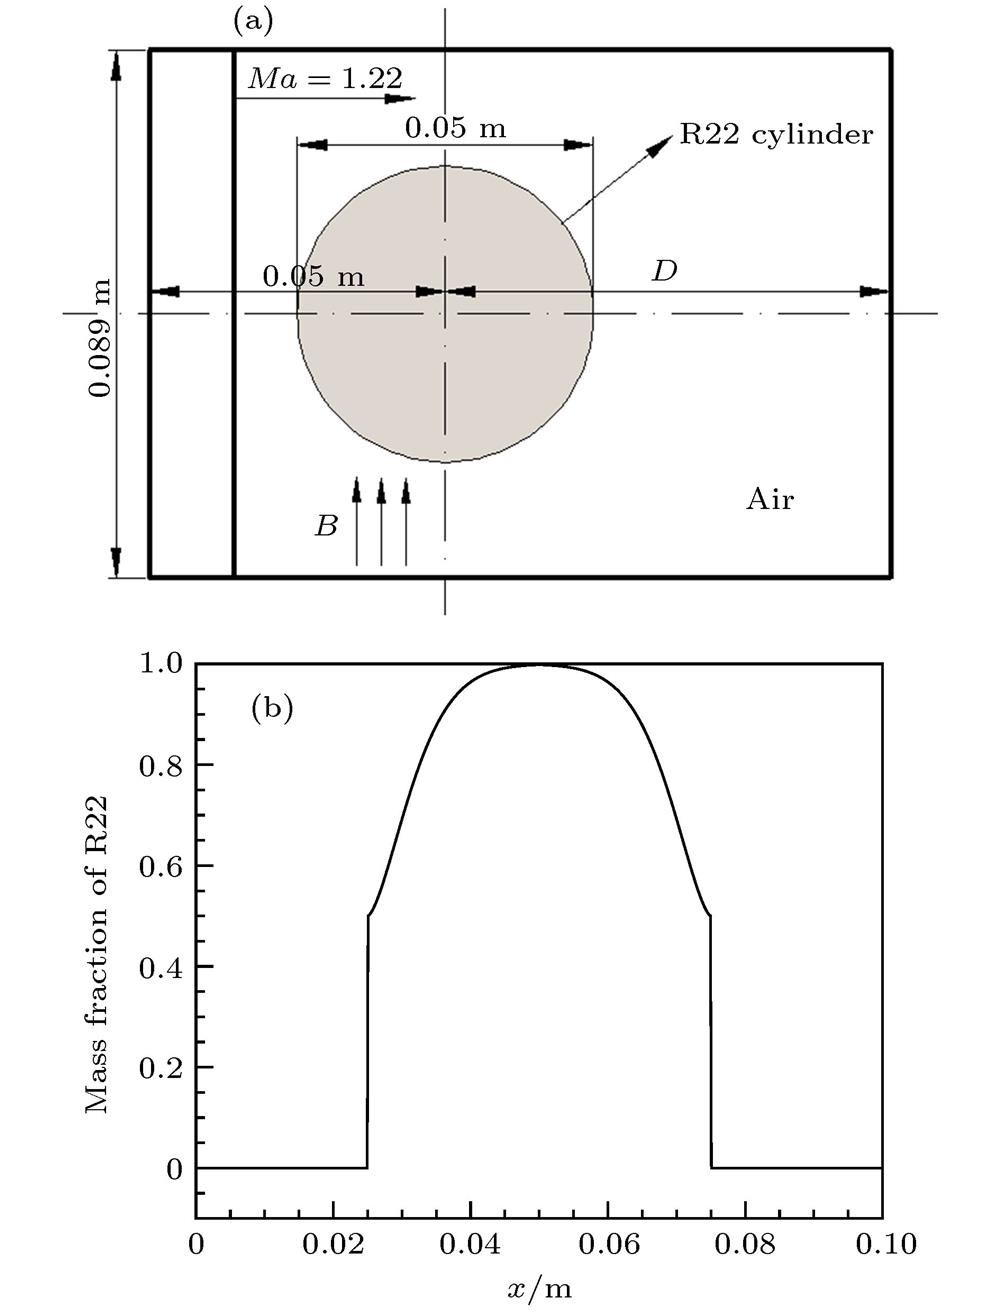
Fig. 1. (a) Schematic of the computational model; (b) the distribution of R22 mole fraction along the symmetry axis of column.
![Comparison of our numerical (up) and experimental[25] (down) shadowgraph images of the interactions between shock wave and gas column: (a) t = 0.09 ms; (b) t = 0.215 ms; (c) t = 0.25 ms; (d) t = 1.20 ms.](/richHtml/wlxb/2020/69/18/20200363/img_2.jpg)
Fig. 2. Comparison of our numerical (up) and experimental[25] (down) shadowgraph images of the interactions between shock wave and gas column: (a) t = 0.09 ms; (b) t = 0.215 ms; (c) t = 0.25 ms; (d) t = 1.20 ms.
Fig. 3. Numerical shadowgraph images of the case in the presence of a magnetic field: (a) t = 0.12 ms; (b) t = 0.2 ms; (c) t = 0.25 ms; (d) t = 0.29 ms; (e) t = 0.425 ms; (f) t = 0.85 ms; (g) t = 1.20 ms; (h) t = 1.55 ms.
Fig. 4. Vorticity distribution in the absence of a magnetic field: (a) t = 0.3 ms; (b) t = 1.2 ms.
Fig. 5. Vorticity distribution in the presence of a magnetic field: (a) t = 0.12 ms; (b) t = 0.2 ms; (c) t = 0.29 ms; (d) t = 0.425 ms; (e) t = 0.85 ms; (f) t = 1.2 ms.
Fig. 6. Spatial distribution of various physical quantities at t = 0.2 ms: (a) Transverse magnetic field; (b) longitudinal magnetic field; (c) magnetic energy; (d) transverse magnetic tension; (e) longitudinal magnetic tension; (f) vorticity.
Fig. 7. Distribution of various physical quantities along the red dotted line of Fig. 6 : (a) Vorticity; (b) magnetic field and magnetic energy; (c) magnetic field gradient and magnetic tension.
Fig. 8. Distribution of magnetic tension vector on the vorticity layer at t = 0.2 ms: (a) Lower half flow field; (b) local enlarged drawing.
Fig. 9. Distribution of the magnetic energy and the magnetic field lines during the evolution of gas column: (a) t = 0.2 ms; (b) t = 0.425 ms; (c) t = 0.85 ms.
Fig. 10. Effect of magnetic tension on interface instability: (a) Transverse magnetic tension; (b) longitudinal magnetic tension; (c) magnetic tension vector.
Fig. 11. Time evolution of the maximum (a) and average (b) magnetic field strength (the red dotted line is the reference line).
Fig. 12. Time evolution of the circulation.

Set citation alerts for the article
Please enter your email address
© Copyright 2018-2021 | Chinese Laser Press. All Rights Reserved 沪ICP备15018463号-20