- Journal of Resources and Ecology
- Vol. 11, Issue 2, 140 (2020)
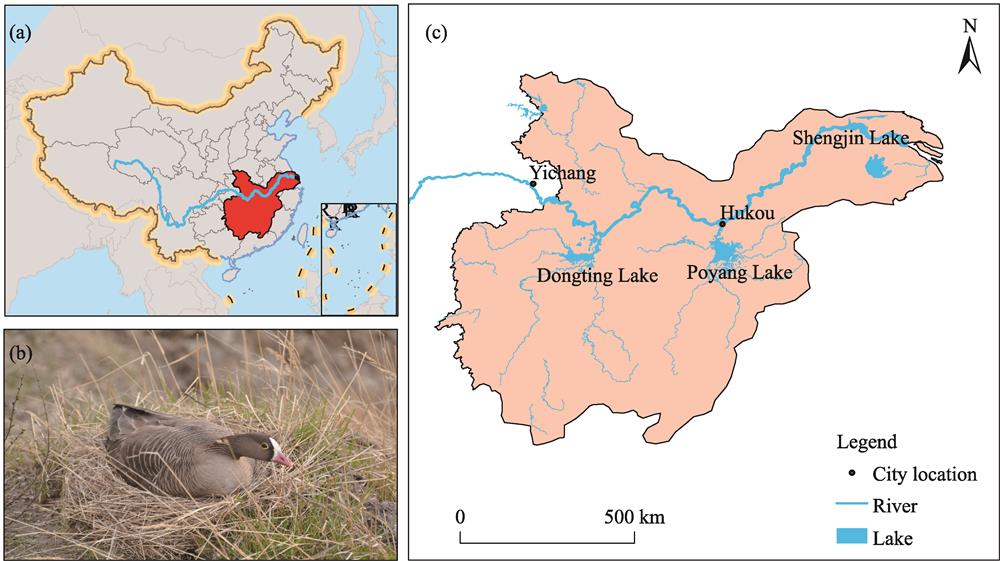
Fig. 1. (a) Map of China and the location of the Middle and Lower Reaches of the Yangtze River; (b) LWfG; (c) Distribution of the main lakes and rivers in the Middle and Lower Reaches of the Yangtze River
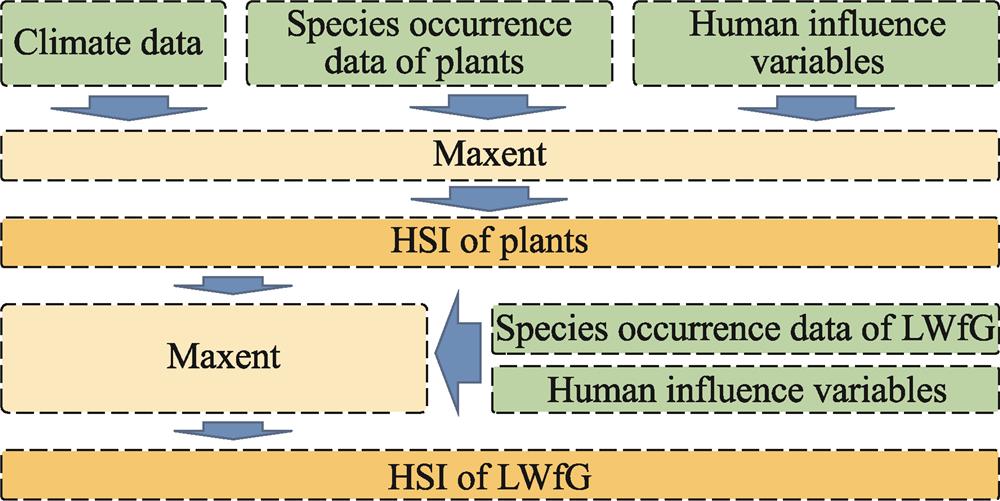
Fig. 2. Flow chart of LWfG habitat suitability modeling
Fig. 3. Profiles of the AUC curves in LWfG habitat suitability model (The red (training) line shows the “fit” of the model to the training data. The blue (testing) line indicates the fit of the model to the testing data, and is the real test of the model’s predictive power)
Fig. 4. Jackknife test of variable contribution results for modeling LWfG’s HSM in the current situation
Fig. 5. Response curves of environmental variables in LWfG HSM (the plots’ x axis describes the environmental variables, the plots’ y axis describes the habitat suitability index). (a) Distance to road (b) Distance to residents (c) Human density (d) Land use (e) Patch density
Fig. 6. Suitable habitat distribution for LWfG in the current and future scenarios. (a) Current situation; (b) RCP2.6; (c) RCP8.5.
Fig. 7. Habitat area of LWfG in different suitability classes (lower, moderately and highly suitable) based on the consensus forecast from 2 GCMs for the current and two RCPs by 2070
|
Table 1.
List of plant species examined and their numbers of occurrences
|
Table 2.
AUC values of plant HSM and LWfG HSM


Set citation alerts for the article
Please enter your email address
© Copyright 2018-2021 | Chinese Laser Press. All Rights Reserved 沪ICP备15018463号-20