• Journal of Natural Resources
  • Vol. 35, Issue 11, 2613 (2020)
Jun SU, Yong-xun WANG, and Qiang WANG*
Author Affiliations
  • School of Geographical Science, Fujian Normal University, Fuzhou 350007, China
  • show less
    DOI: 10.31497/zrzyxb.20201105 Cite this Article
    Jun SU, Yong-xun WANG, Qiang WANG. Pattern evolution of global energy security and the geopolitical game[J]. Journal of Natural Resources, 2020, 35(11): 2613 Copy Citation Text show less
    The evolution of the world energy security pattern since 2000
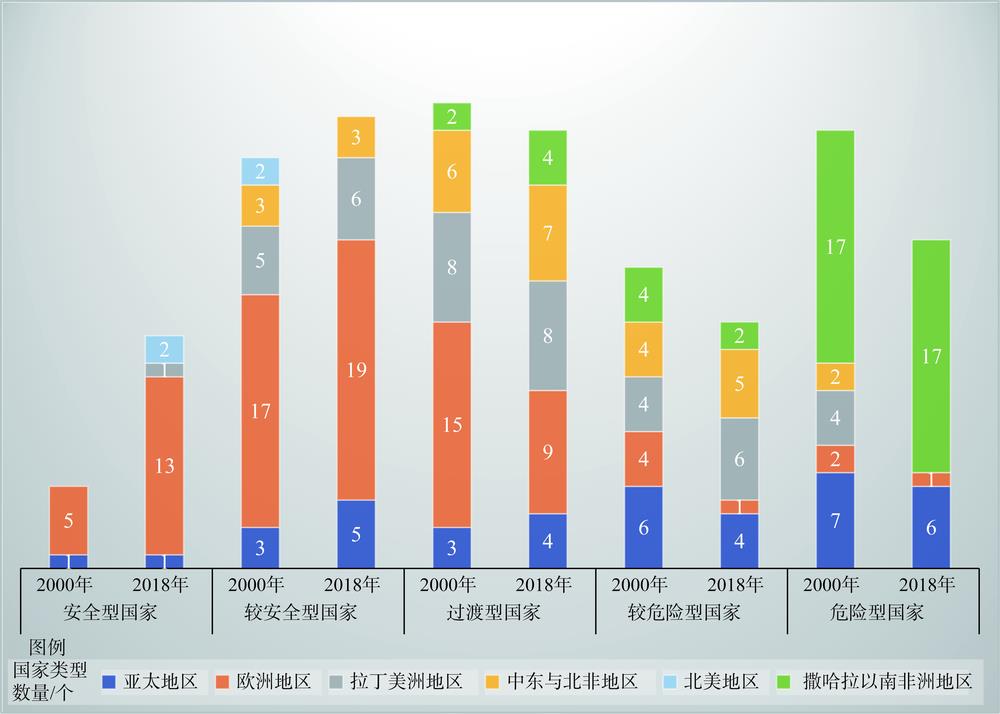
    Fig. 1. The evolution of the world energy security pattern since 2000
    Performance of three main dimensions of energy system of energy-safe countries
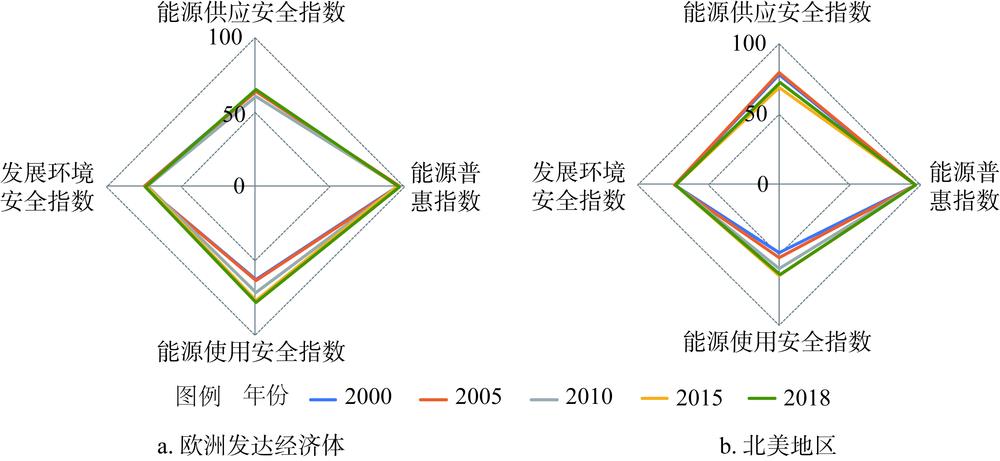
    Fig. 2. Performance of three main dimensions of energy system of energy-safe countries
    Scatter plots of energy supply safety index and energy use safety index for countries with relatively safe energy system in 2000 and 2018
    Fig. 3. Scatter plots of energy supply safety index and energy use safety index for countries with relatively safe energy system in 2000 and 2018
    Energy security performance of former Soviet Union countries in European Union and Asian high-income countries
    Fig. 4. Energy security performance of former Soviet Union countries in European Union and Asian high-income countries
    Energy security performance of energy-rich countries
    Fig. 5. Energy security performance of energy-rich countries
    Energy security performance of countries with energy system in transition
    Fig. 6. Energy security performance of countries with energy system in transition
    Performance of countries with relatively dangerous or dangerous energy system
    Fig. 7. Performance of countries with relatively dangerous or dangerous energy system
    Density distribution curves of global energy security index and its main three sub-indexes
    Fig. 8. Density distribution curves of global energy security index and its main three sub-indexes
    The evolution of energy security index and its three sub-indexes at different development stages
    Fig. 9. The evolution of energy security index and its three sub-indexes at different development stages
    目标层维度层指标层单位权重/%说明
    维度层指标层
    能源安全综合指数供应维度一次能源生产量与消费量之比357供应维度用以描述和评价区域能源系统应对能源供给—需求关系失调的能力
    能源供应多样性系数7
    电力多样性系数7
    原油储备量亿桶7
    天然气储备量万亿立方英尺7
    普惠维度通电率%186普惠维度用以表征能源系统满足区域生产、生活用能需求的综合能力
    汽油零售价格美元/升6
    非固态燃料获得率%6
    使用维度化石能源所占比例%328使用维度用以测度区域能源使用的环境效应
    可再生能源发电所占比例%8
    碳排放因子t/t油当量8
    能源效率103美元/t油当量(已转换为2011年不变价)8
    发展环境政治稳定性152发展环境主要是指区域能源发展的社会、政治与经济环境,其优劣程度显著影响着国家在能源市场中的话语权,以及本地能源政策制定与能源部门投资,继而影响着自身能源安全水平
    管理水平2
    政府效率2
    法律角色2
    腐败控制2
    人均GDP美元(已转换为2011年不变价)5
    Table 1. Indicators for the construction of national energy security
    类型区2000年2005年2010年2015年2018年2000—2018年变化情况其中
    2010—2018年2000—2010年
    安全型国家6891417+11+8+3
    较安全型国家3026252933+3+8-5
    过渡型国家3440403532-2-8+6
    较危险型国家2218212318-4-3-1
    危险型国家3232292324-8-5-3
    Table 2. [in Chinese]
    Jun SU, Yong-xun WANG, Qiang WANG. Pattern evolution of global energy security and the geopolitical game[J]. Journal of Natural Resources, 2020, 35(11): 2613
    Download Citation