
Sheng ZHANG, Yongjun WANG, Ruijun WANG, Qingbo HUANG, Chunlei ZHANG, Mingyang WU. Development of an online monitoring system for water body γ radioactivity based on 4G-RTU[J]. NUCLEAR TECHNIQUES, 2024, 47(1): 010402
- NUCLEAR TECHNIQUES
- Vol. 47, Issue 1, 010402 (2024)
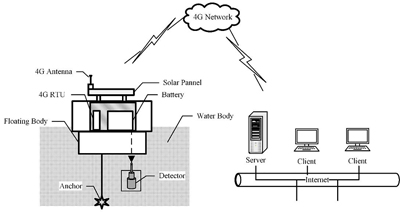
Fig. 1. Architecture schematic of online monitoring system for γ radioactivity in a body of water
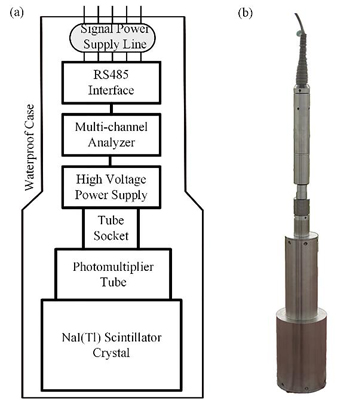
Fig. 2. Schematic diagram (a) and photograph (b) of the detector unit
Fig. 3. Schematic diagram of the networking mode and order flow of the 4G-RTU communication unit
Fig. 4. Schematic diagram (a) and photograph (b) of the floating body unit
Fig. 5. System software design framework
Fig. 6. Flowchart of software implementation method (a) and actual operating interface (b)
Fig. 7. Two measured spectra of the 137Cs energy resolution
Fig. 8. Two measured spectra of the energy spectrum peak drift test
Fig. 9. Liner fitting line and equation of the energy linearity test
Fig. 10. YM2 model test photograph (a) and measured spectrum (b)
Fig. 11. System working temperature test photograph (a) and measured window data curves (b)
Fig. 12. Photograph of 137Cs volume source and lead chamber (a) and spectrum with removed background (b)
Fig. 13. Actual on-site photograph of the measured field in the Taiping river of Shijiazhuang city
Fig. 14. TC, K, U, and Th window count rate curves for every 300 s of sampling time
|
Table 1. Energy resolution test results
|
Table 2. Energy spectrum peak drift test results
|
Table 3. γ energy window settings of the system
| |||||||||||||||||||||||||||||||||||||||||||||||||||||||||||||||||||||
Table 4. System stability test results


Set citation alerts for the article
Please enter your email address

© Copyright 2018-2021 | Chinese Laser Press. All Rights Reserved 沪ICP备15018463号-20