• Acta Photonica Sinica
  • Vol. 50, Issue 12, 1217001 (2021)
Nan CHENG2, Limin ZHANG1、3、*, Zhichao ZHAO1, Yingxue PAN1, Xin WANG4, Zhongxing ZHOU1、3, and Feng GAO1、3
Author Affiliations
  • 1College of Precision Instrument and Optoelectronics Engineering, Tianjin University, Tianjin 300072, China
  • 2Tianjin International Engineering Institute, Tianjin University, Tianjin 300072, China
  • 3Tianjin Key Laboratory of Biomedical Detecting Techniques and Instruments, Tianjin 300072, China
  • 4School of Great Health and Intelligent Engineering, Chengdu Medical College, Chengdu 610500, China
  • show less
    DOI: 10.3788/gzxb20215012.1217001 Cite this Article
    Nan CHENG, Limin ZHANG, Zhichao ZHAO, Yingxue PAN, Xin WANG, Zhongxing ZHOU, Feng GAO. Optimization of Fluorescence Pharmacokinetic Tomography Based on Kalman Filtering[J]. Acta Photonica Sinica, 2021, 50(12): 1217001 Copy Citation Text show less
    Two-compartmental model of ICG pharmacokinetics
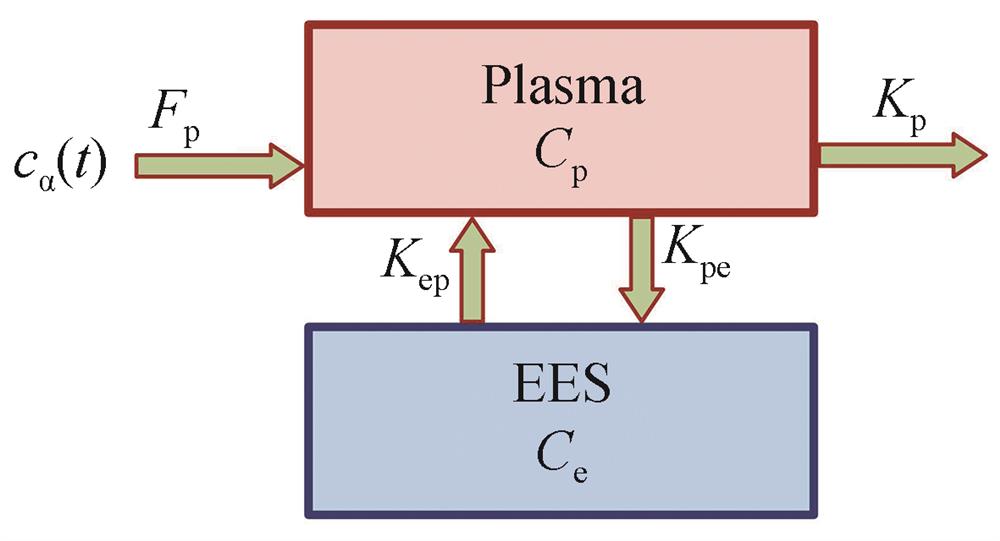
    Fig. 1. Two-compartmental model of ICG pharmacokinetics
    Schematic of dynamic fluorescence diffuse tomography system
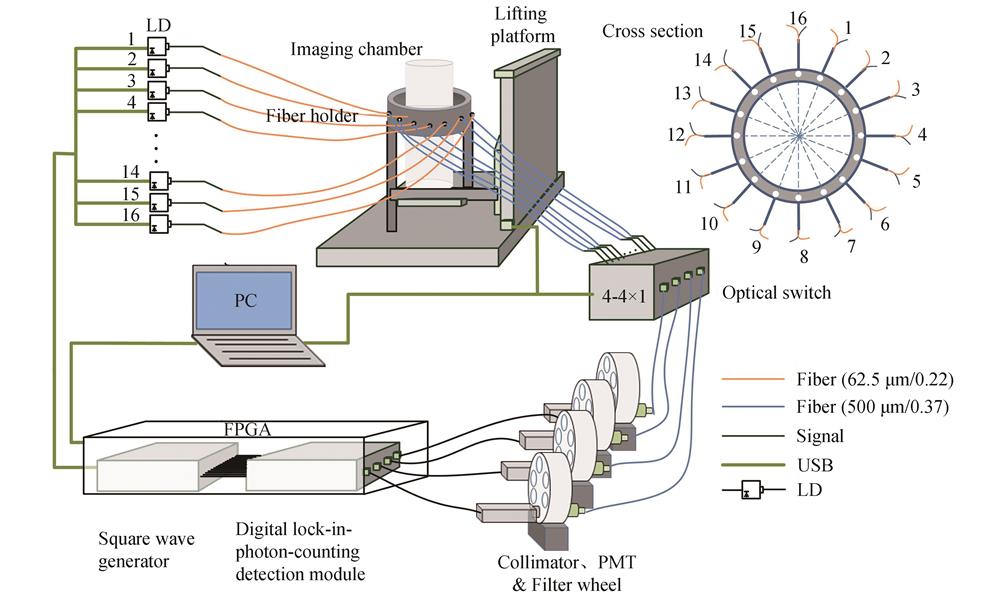
    Fig. 2. Schematic of dynamic fluorescence diffuse tomography system
    The simulated reconstruction results of first-order AEKF, second-order AEKF and UKF when the contrast is 2, 3 and 4, and their X-profiles
    Fig. 3. The simulated reconstruction results of first-order AEKF, second-order AEKF and UKF when the contrast is 2, 3 and 4, and their X-profiles
    Comparison of CNR and QR of the simulation results obtained by first-order AEKF, second-order AEKF and UKF
    Fig. 4. Comparison of CNR and QR of the simulation results obtained by first-order AEKF, second-order AEKF and UKF
    Experimental images of mouse liver positioning and scanning, and Micro-CT tomograms of the calibrated parts
    Fig. 5. Experimental images of mouse liver positioning and scanning, and Micro-CT tomograms of the calibrated parts
    The fusion of the reconstructed images of the time-series fluorescence yield of the mouse liver and the Micro-CT images with the time interval of 4 minutes
    Fig. 6. The fusion of the reconstructed images of the time-series fluorescence yield of the mouse liver and the Micro-CT images with the time interval of 4 minutes
    Comparison of the in vivo experimental results of first-order AEKF, second-order AEKF, and UKF
    Fig. 7. Comparison of the in vivo experimental results of first-order AEKF, second-order AEKF, and UKF
    CNR comparison of Kep and Kpe obtained by first-order AEKF, second-order EKF and UKF in mouse experiment
    Fig. 8. CNR comparison of Kep and Kpe obtained by first-order AEKF, second-order EKF and UKF in mouse experiment
    Nan CHENG, Limin ZHANG, Zhichao ZHAO, Yingxue PAN, Xin WANG, Zhongxing ZHOU, Feng GAO. Optimization of Fluorescence Pharmacokinetic Tomography Based on Kalman Filtering[J]. Acta Photonica Sinica, 2021, 50(12): 1217001
    Download Citation