
Zhongzheng Lin, Jianqi Hu, Yujie Chen, Camille-Sophie Brès, Siyuan Yu. Single-shot Kramers–Kronig complex orbital angular momentum spectrum retrieval[J]. Advanced Photonics, 2023, 5(3): 036006
- Advanced Photonics
- Vol. 5, Issue 3, 036006 (2023)
Abstract
1 Introduction
Structured light waves with spiral phase fronts carry orbital angular momentum (OAM). Such helical optical beams, either naturally emitted from laser cavities1 or externally sculpted,2 have recently attracted significant attention and have been widely used in communication, sensing, imaging, as well as classical and quantum information processing.3
Typical OAM interference measurements are performed by recording the interferograms of a complex signal field and a reference OAM mode (or Gaussian beam) with a camera.21
Notably, the interference measurement of the complex OAM spectrum resembles the detection of complex modulated signals in coherent optical communications, where the reference beam is the counterpart of the local oscillator. A phase-diverse coherent receiver is generally used to retrieve both the amplitude and phase of the modulated signal.25 In recent years, considerable efforts have been made to reduce the receiver complexity in coherent communication systems, ideally by using only one single-ended photodetector.26
Sign up for Advanced Photonics TOC. Get the latest issue of Advanced Photonics delivered right to you!Sign up now
In this work, by drawing a close analogy between the time-frequency and azimuth-OAM domains, we extend the KK retrieval concept into the OAM space, for the first time to our knowledge. Such an approach enables the readout of both the amplitude and phase relation of an arbitrary OAM state in a single-shot manner without increasing the system complexity. We describe in detail the retrieval procedure, which is experimentally validated in a high-dimensional OAM space. In particular, we demonstrate the diagnosis of a number of characteristic OAM states,34
2 Results
2.1 Principle of Operation
A complex OAM field can be described by the controlled superposition in discrete OAM mode basis:34
![]()
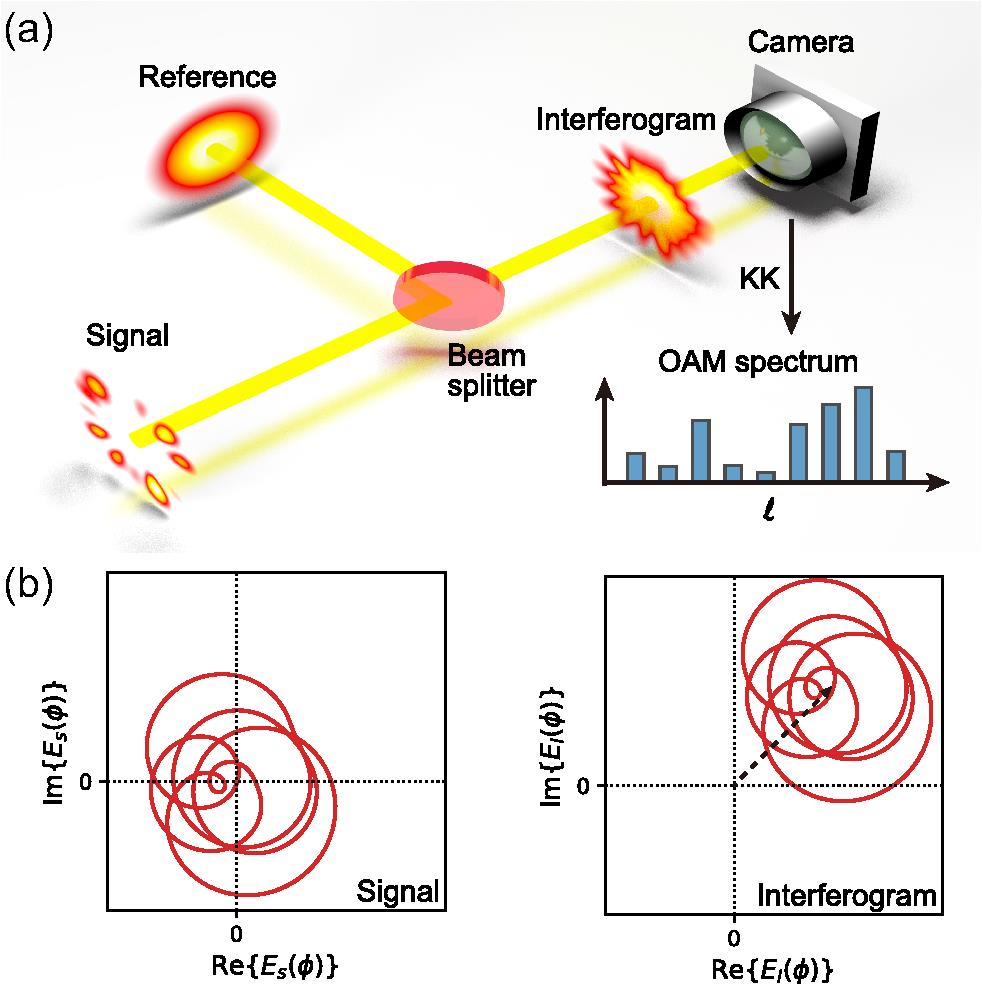
Figure 1.Conceptual setup and the requirement for the KK retrieval. (a) The signal field with a complex OAM spectrum is co-axially combined with a reference Gaussian beam. The intensity of their interferogram is recorded with a camera and is used for the spectrum retrieval. (b) The azimuthal trajectories of the signal (left) and the interferogram (right) in the complex plane. In order to meet the minimum phase condition, the trajectory must not encircle the origin. With the addition of a sufficiently large reference field (denoted by the dashed arrow), the interferogram satisfies the requirement, and thus the KK method can rigorously reconstruct the complex signal OAM spectrum.
The third term in the last equality of Eq. (2) contains all the Fourier coefficients required to reconstruct the signal field, apart from scaling and a constant phase shift, while the second term corresponds to the SSBI.
To extract the phase information from a single intensity measurement, the amplitude and phase of the interferogram must be uniquely linked. A way to look at this is using the -extension as formulated in Ref. 31. By replacing the in with a variable , the interferogram becomes a polynomial function,
Once the minimum phase condition is reached, for an interference field (arg denotes the argument), the logarithm of its amplitude and phase are related by the Hilbert transform,31
2.2 Experimental KK Retrieval Procedure
In the experiment, the complex signal OAM fields are synthesized using computer-generated holograms and an optical 4-f system.42 They consist of arbitrary superpositions of ring-shaped OAM modes with topological charges spanning 1 to 20. The OAM fields under test are then co-axially combined with a reference Gaussian beam, and their interferograms are recorded with a camera. The detailed experimental setup is described in the Note S1 in the Supplemental Material. To satisfy the minimum phase condition, we tune the reference light power slightly above the power threshold set by the minimum required CSPR. Due to the signal preparation method we used,42 the experimental and minimum required CSPR difference is kept constant () for different measurement instances (see Note S2 in the Supplemental Material). In the following, we demonstrate the KK retrieval procedure on a random complex OAM spectrum as an example. The top panel of Fig. 2(a) shows the measured camera images of the reference and the interference beams. Their azimuthal intensity distributions are extracted by sampling around the interfering regions (indicated by the dashed circles) and unwrapped as shown in the bottom panel of Fig. 2(a). It can be seen that the measured reference shows small intensity fluctuations in the azimuthal direction. Such a reference intensity pattern is unchanged while characterizing different signal OAM fields, so only their interferogram needs to be measured each time, suggesting that the retrieval process is a single shot.
![]()
Figure 2.Experimental single-shot KK retrieval. (a)–(c) Retrieval process of an arbitrary OAM spectrum. (a) The intensity images of the reference (top left) and the interferogram (top right) are captured by a camera. By sampling along the dashed circles in the images, their azimuthal distributions are extracted (bottom). (b) The interferogram is then normalized and digitally upsampled, whose phase is extracted from the Hilbert transform of the logarithm of its amplitude (top). From the full field of the interferogram, the amplitude and phase of the signal are obtained and downsampled to the original sampling points (bottom). (c) Taking the Fourier transform of the signal field derives the normalized amplitude (top) and relative phase relation (bottom) of the OAM spectrum. An accuracy of 97.6% is achieved by comparing the retrieved and the target OAM spectra. (d), (e) Measured 2D bar charts of the OAM states for (d) the superpositions of mode indices from 1 to
Similar to the KK full-field retrieval in space and time,28,32 digital upsampling may also be required in our case if the number of physical sampling points is not sufficiently large to cover the spectrum expended by the logarithmic operation.31 The effect of upsampling is discussed in Note S3 in the Supplemental Material. Throughout the paper, we take 71 azimuthal sampling points in the experiment, and then we digitally upsample the normalized interferogram by 11 times for the subsequent processing. The top panel of the Fig. 2(b) shows the logarithm of the upsampled interferogram as well as its Hilbert transform . Instead of taking the convolution as defined in Eq. (5), the actual implementation of the Hilbert transform is realized in the spectral domain using the fast Fourier transform and the sign function.28 The full field of the interferogram is thus derived, from which the full signal field can be easily calculated by . Here, we omit the negligible phase nonuniformity of the experimental reference beam. The retrieved signal field is then downsampled, whose normalized amplitude and phase are plotted in the bottom panel of Fig. 2(b). Finally, the complex signal OAM spectrum is retrieved by taking the Fourier transform of . The step-by-step workflow for KK retrieval is described in Note S4 in the Supplemental Material, and the code is also provided therein. Figure 2(c) shows the retrieved amplitude (top) and phase (bottom) profile of the OAM spectrum compared to the ground truth. It can be seen that they are in excellent agreement. To quantitatively assess the performance of the KK retrieval, we introduce the following metric based on the overlap integral of the target and the retrieved OAM spectra,
To further test the validity of the proposed method, we apply the KK retrieval to diagnose a series of OAM spectra shown in Figs. 2(d) and 2(e). The first scenario is the rectangular OAM spectra of different widths (), where the constituent OAM modes are of equal amplitudes and in-phase relations. Figure 2(d) shows the real and imaginary parts of the measured OAM spectra for these cases in a complex two-dimensional (2D) bar chart. As expected, the retrieved OAM spectra are approximately of rectangular shapes and are mainly populated in the real part of the bar chart due to their in-phase features. An average accuracy of 98.9% is achieved for these measurements. For the second scenario, the OAM spectra are structured by , where . In this case, the bar chart should be diagonal in its real part but antidiagonal in its imaginary part. This is clearly observed in the measurements shown in Fig. 2(e), with an average retrieval accuracy reaching 96.0%.
2.3 Measurement of Characteristic OAM States
The single-shot KK full-field retrieval allows for the simple characterization of complex OAM states. In the following, we study various characteristic OAM spectra displayed in Fig. 3. Figure 3(a) demonstrates the measurement of a signal field with a Gaussian-shaped, in-phase OAM spectrum centered at the 10th order, i.e., , which corresponds to a bright petal horizontally aligned in the azimuthal angle.34 From only a single interferogram, we can reconstruct the signal’s OAM spectrum, which matches the ground truth well. As a single-shot retrieval method, we only use the interferograms to reconstruct the complex OAM fields. Note that all the measured images of the signal beams in Fig. 3 are displayed only as the ground truth and to help visualization of the signal fields, but they are not used for their OAM spectra retrieval. Figure 3(b) shows the condition for the same petal field as in Fig. 3(a) except being rotated by counterclockwise. A linear phase ramp is thus imparted to the OAM spectrum due to the rotation, with a phase slope of . This feature is well captured by the KK approach in a single-shot fashion, simplifying the previously used schemes, such as the sequential weak and strong measurements35 or the phase-shifting holograms.43
![]()
Figure 3.Measurements of complex OAM spectra. Left, the measured intensity images of the signal and the interferogram; right, the normalized amplitude and relative phase of the target and experimentally retrieved OAM spectrum. (a)–(d) Gaussian-shaped OAM spectra centered at 10th order with versatile OAM mode spacings and relative phase relations. (a) In-phase OAM spectrum with a mode spacing of 1. (b) Linear-phase OAM spectrum with a phase slope of
In addition, it is known that increasing the mode spacing in the OAM spectrum will lead to the multiplication of petals in the azimuthal angle.34 This is shown in Fig. 3(c), where a three-petal field under test is constructed from in-phase OAM modes with an order spacing of 3 and the same envelope as in Figs. 3(a) and 3(b). The interferogram could accurately retrieve its equidistant OAM structure as well as its in-phase relation. Notice that the large phase error in Fig. 3(c) is only associated with void OAM modes or at small modal amplitudes. Furthermore, we investigate the complex OAM spectrum of the petal field in Fig. 3(c) being subjected to phase modulation. Specifically, when the three petals are modulated with the Talbot phase sequence of , the initial OAM spectrum is self-imaged to create new OAM modes while preserving its overall envelope.37 The measurement results are shown in Fig. 3(d). Although the signal intensity patterns in Figs. 3(c) and 3(d) are identical, the phenomenon of the OAM spectral self-imaging is clearly observed from the KK retrieval. More interestingly, the approach also provides a direct phase measurement of all the OAM modes. It can be seen that the relative phases of OAM self-images again follow the Talbot relation of , apart from a constant phase [subtracted thus not shown in Fig. 3(d) for better representability]. Notably, such a phase structure of Talbot self-images has only been recently determined in space44 and time,45 while here we measure it for the first time in the OAM basis. The measured quadratic phase relation suggests that the origin of self-imaging here is different from the Gouy-phase-mediated revivals of spatial fields.46
We also use the KK method to characterize the complex spectra of fractional OAM modes. A fractional OAM order can be viewed as the weighted superposition of integer OAM modes.49 In Fig. 3(e), we show the measurement of the fractional OAM field with a topological charge of 9.5, i.e., . The field intrinsically exhibits around 1% power leakage to the negative OAM orders, thus not rigorously satisfying the single-sideband requirement. Nevertheless, since the leakage is small, the KK retrieval still works effectively with an accuracy of 95.6%. We can see that the fractional OAM field in Fig. 3(e) is mainly composed of the 9th and 10th OAM modes, together with the other OAM orders slowly decaying when moving away from the center modes. Moreover, we are able to identify the phase relation of its constituent OAM modes, which is rarely explored for the fractional OAM states. It is found that the orders at the left and right parts of the fractional OAM spectrum are approximately out of phase. The phase deviation between the measured and theoretical fractional OAM spectra may come in part from the finite sampling in the azimuthal angle.
2.4 Effect of CSPR Levels
Figure 4 shows the KK retrieval performance at different CSPR levels. As an example, the same OAM state in Fig. 3(a) is used as the signal field for the study, whose complex amplitude field is displayed in Fig. 4(a). From this we can plot in Fig. 4(b) the trajectory of its azimuthal distribution in the complex plane. As mentioned previously, to guarantee rigorous KK retrieval, the trajectory of the signal field after interfering with the reference light must not encircle the origin of the complex plane. The minimum required reference intensity for such a criterion is highly dependent on the relative angle between the reference and the signal fields. In Fig. 4(b), the minimum required CSPR varies in a range between 5.1 and 11.3 dB, where the lower and upper bounds correspond to the reference field being added in-phase () and out-of-phase () with the signal field, respectively. The minimum required CSPR value valid for all these relative angles is thus set by the upper bound, i.e., 11.3 dB.
![]()
Figure 4.KK retrieval at different CSPR levels. (a) The complex amplitude field of the signal used for the study [the same as the signal field in
Figure 4(c) presents the experimental results for the retrieval accuracy at different CSPR levels and various relative phases between the signal and reference fields. In the experiment, the control of the CSPR and its relative phase are realized via the computer-generated holograms. The phases shown in Fig. 4(c) are varied in steps of . We emphasize here that they do not correspond to the actual but are offset from a constant unknown phase due to experimental constraints. In Fig. 4(c), when the experimental CSPR is well below the 11.3 dB threshold (marked by the dashed line), the retrieval performance changes significantly with the phase, although for some angles the retrieval accuracy is acceptable. Once the CSPR exceeds the threshold, decent retrieval is achieved for arbitrary relative phases between the reference and signal fields. The experimental results in Fig. 4(c) are in accordance with the theoretical analysis carried out above.
2.5 Performance Evaluation
In this part, we evaluate the performance of the KK retrieval on a large set of OAM spectra generated with random complex mode coefficients. As in the previous measurements, the difference between the experimental and minimum required CSPRs is automatically maintained around 1 dB, which is experimentally confirmed in Note S2 in the Supplemental Material for 100 random OAM spectra. Figure 5(a) shows the histogram of the KK retrieval accuracy for 1000 spectrum samples on the same dimensional space as before. An average retrieval accuracy of 95.6% is obtained, with a standard deviation of 1.2%. The performance of the KK retrieval is also compared with the conventional Fourier method,21,50 computed by the Fourier transform disregarding the SSBI in Eq. (2). A clear advantage of using the KK method is shown in Fig. 5(a), suggesting that the SSBI cannot be neglected under such a CSPR level. Nevertheless, the field retrieved by the Fourier method does gradually approach the ground truth with the increase of CSPR values. The detailed discussion of the Fourier method can be found in Note S5 in the Supplemental Material. Next, we further push the measurement dimensionality up to the 30th OAM order while keeping the azimuthal sampling points and the digital upsampling unchanged. Figure 5(b) shows the corresponding experimental results. The average KK retrieval accuracy in this case still reaches 91.1% with a standard deviation of 1.4%, outperforming the conventional Fourier method by a large margin. Although the performance of the Fourier method may be improved by increasing the reference power, keeping relatively low CSPR values is favored to avoid large DC components in detection, thus maximally utilizing the dynamic range of the camera.
![]()
Figure 5.Performance evaluation of the KK retrieval on random OAM spectra. (a), (b) Histograms of the retrieval accuracy of the KK method and the conventional Fourier method, measured on 1000 OAM spectra with random complex mode coefficients. (a) For an OAM measurement range from 1 to 20, the average and standard deviation of the KK retrieval accuracy are 95.6% and 1.2%, respectively. (b) For an OAM measurement range from 1 to 30, the average and standard deviation of the KK retrieval accuracy are 91.1% and 1.4%, respectively. The KK method shows superiority over the Fourier method in both cases.
3 Discussion
The experimental setup used in this work is a conventional on-axis interferometer equivalent to the configurations in Refs. 21–23. However, contrary to all the past demonstrations that require a few shots to diagnose a complex OAM spectrum, our method provides single-shot retrieval mediated by the famous KK relation. This greatly accelerates the measurement, as it bypasses the need to adjust the amplitude and/or phase of the reference when characterizing each superimposed state.21
To sum up this work, we propose and experimentally demonstrate a high-dimensional OAM analyzer that can measure complex OAM states in one single shot. The idea is inspired by the KK receiver in optical communications, while here we introduce the same concept to the OAM spectrum analysis and represent a new application scenario of KK phase retrieval. As demonstrated here, the proposed single-shot KK interferometry can be readily employed for state measurements in OAM-based information processing, sensing, and communication systems. This work also implies the general duality between azimuth-OAM and time-frequency, suggesting that their processing techniques may be borrowed interchangeably.
Zhongzheng Lin received his BS degree in physics from Dalian University of Technology, Dalian, China, in 2018. He is currently a PhD candidate in the School of Electronics and Information Technology at Sun Yat-sen University, Guangzhou, China. His research mainly focuses on the manipulation and detection of the structured light, especially optical vortices.
Jianqi Hu received his BE degree from the University of Electronic Science and Technology of China, in 2016, and his PhD in photonics from École Polytechnique Fédérale de Lausanne (EPFL), Switzerland, in 2021. He continued his research as a postdoc at EPFL from 2021 to 2022. Currently, he is an SNF postdoc fellow in Laboratoire Kastler Brossel, Ėcole Normale Supérieure, France. His research interests include integrated nonlinear photonics, frequency combs, orbital angular momentum, and optical computing.
Yujie Chen received his PhD in physics (photonics) from the Institute of Photonics, University of Strathclyde, Glasgow, United Kingdom, in 2012. He is currently a professor in the School of Electronics and Information Technology, Sun Yat-sen University, Guangzhou, China. His research interests include micro/nano-structured photonic devices for manipulating light fields, as well as their applications in optical information processing and optical communications.
Camille-Sophie Brès received her bachelor’s degree in electrical engineering from McGill University, Canada, in 2002, and her PhD in electrical engineering from Princeton University, USA, in 2007. After a postdoc at UCSD, she joined the Institute of Electrical Engineering at EPFL, Switzerland, where she is currently an associate professor. Her work focusses on leveraging and enhancing nonlinear processes in optical waveguides for the optimization of light conversion, signal processing, and sensing. She was elected fellow of Optica in 2019.
Siyuan Yu received his PhD in photonics from the University of Glasgow, United Kingdom, in 1997. He is currently a professor with Sun Yat-sen University, Guangzhou, China. He has helped in pioneering areas, such as high-speed integrated optical switches, microring lasers, integrated quantum photonics, and more recently, mode-division multiplexing devices and systems based on orbital angular momentum modes of light. He has published over 200 papers, including two cover features on science, and has been granted several international patents.
References
[4] H. Rubinsztein-Dunlop et al. Roadmap on structured light. J. Opt., 19, 013001(2016).
[5] M. J. Padgett. Orbital angular momentum 25 years on. Opt. Express, 25, 11265-11274(2017).
[18] N. K. Fontaine et al. Laguerre-Gaussian mode sorter. Nat. Commun., 10, 1865(2019).
[19] Y. Zhang et al. Simultaneous sorting of wavelengths and spatial modes using multi-plane light conversion(2020).
[25] E. Ip et al. Coherent detection in optical fiber systems. Opt. Express, 16, 753-791(2008).
[40] A. Mecozzi. A necessary and sufficient condition for minimum phase and implications for phase retrieval(2016).
[41] V. Cizek. Discrete Hilbert transform. IEEE Trans. Audio Electroacoust., 18, 340-343(1970).
[49] H. Zhang et al. Review on fractional vortex beam. Nanophotonics, 11, 241-273(2022).

Set citation alerts for the article
Please enter your email address
© Copyright 2018-2021 | Chinese Laser Press. All Rights Reserved 沪ICP备15018463号-20