
Kaiyong WANG, Rundong FENG. Quantitative simulation and empirical analysis of regional effects of administrative division adjustment from the perspective of coordinated development [J]. Acta Geographica Sinica, 2020, 75(8): 1617
- Acta Geographica Sinica
- Vol. 75, Issue 8, 1617 (2020)
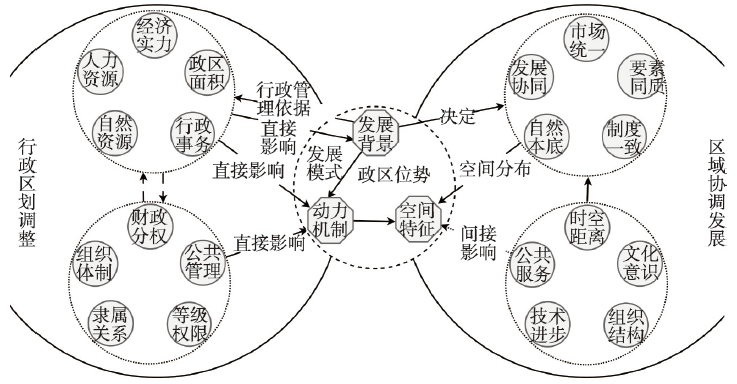
Fig. 1. Interpretation framework of regional effects of administrative division adjustment from the perspective of regional harmonious development
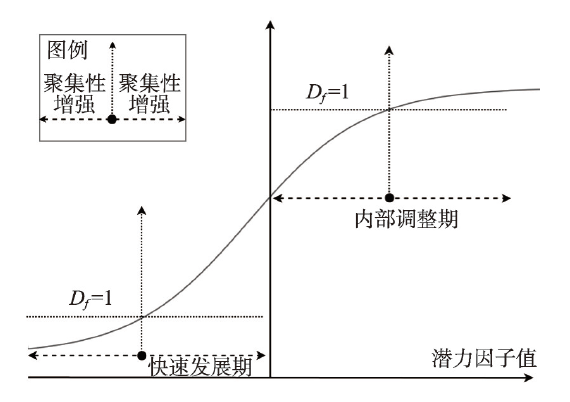
Fig. 2. Conceptual map of regional coordination potential coefficient
Fig. 3. Conceptual map of regional coordination potential coefficient in the rapid development
Fig. 4. Hefei-Wuhu dual-core spatial distribution before and after administrative division adjustment
Fig. 5. Reachable personality in Hefei-Wuhu region
Fig. 6. Spatial pattern of potential coefficients of coordinated development in Hefei Wuhu region
Fig. 7. The spatial pattern of ARPE in Hefei-Wuhu region
Fig. 8. The spatial evolution of ARPE in Hefei-Wuhu region from 2005 to 2015
Fig. 9. The influence of administrative division adjustment on the spatial effect of the ARPE in the Hefei-Wuhu region
Fig. 10. A comparison of the changes in the ARPE and socio-economic development of districts and counties in Hefei-Wuhu region
|
Table 1. Indicator system and treatment of regional effect of administrative division adjustment
| ||||||||||||||||||||||||||||||||||||||||||||||||||||||||||||||||||||||
Table 2. Nodular index of Hefei-Wuhu region from 2005 to 2015
| ||||||||||||||||||||||||||||||||||||||||||||||||||
Table 3. ARPE of Hefei-Wuhu administrative region from 2005 to 2015

Set citation alerts for the article
Please enter your email address
© Copyright 2018-2021 | Chinese Laser Press. All Rights Reserved 沪ICP备15018463号-20