
Vladimir Andreevich USOLTSEV, Seyed Omid Reza SHOBAIRI, Ivan Stepanovich TSEPORDEY, Amirhossein AHRARI, Meng ZHANG, Ahmad Anees SHOAIB, Viktor Petrovich CHASOVSKIKH. Are There Differences in the Response of Natural Stand and Plantation Biomass to Changes in Temperature and Precipitation? A Case for Two-needled Pines in Eurasia[J]. Journal of Resources and Ecology, 2020, 11(4): 331
- Journal of Resources and Ecology
- Vol. 11, Issue 4, 331 (2020)
Abstract
Keywords
1 Introduction
Current climate change make it increasingly important to assess the response of forest cover biomass to this change, which in turn determines the possibility of climate stabilization by reducing atmospheric CO2. The planet’s natural forests are slowly decreasing by 6-13 million ha annually and are often replaced by artificial ones that continue to grow (
Today, in the face of increasing anthropogenic pressure and climate change, it is important to know all the advantages and disadvantages of both natural stands and plantations in terms of biological productivity and their ability to mitigate climate change. Discussions related to production advantages of natural and artificial forests began from the time of the first forest plantings and continue to this day. Numerous studies prove the presence of higher production indices of plantations in comparison with natural stands. (
Recently, a comparative analysis of the accuracy of different methods for determining the biological productivity of some tree species was fulfilled, and it was shown that allometric models designed at a tree scale give a smaller prediction error compared to models performed at the forest stand scale (
Since climate variables are geographically determined, it can be expected that the development of allometric biomass models, including not only the age, height and stem diameter as independent variables, but also climate indices, will allow to isolate and quantify some changes in the biomass structure of equal-aged and equal-sized trees in relation to climate variables and will provide climate-sensitivity of such models (
In our study, the first attempt is made to compare the changes in the component composition of tree biomass of two-needled pines of natural and artificial origin by trans-Eurasian hydrothermal gradients.
2 Material and methods
A unique Eurasian database of harvest data on single-tree biomass compiled by
| Regions | Species of the | Ages | DBH | Heights | Sample No. | ||
|---|---|---|---|---|---|---|---|
| Natural stand | |||||||
| West Europe | 11-100 | 1.4-53.1 | 2.3-32.0 | 19 | |||
| Scandinavia | 9-212 | 1.9-42.0 | 3.3-32.4 | 117 | |||
| The Ukraine and Byelorussia | 24-186 | 1.5-54.6 | 1.6-36.6 | 205 | |||
| European Russia | 10-207 | 0.9-54.0 | 2.2-30.2 | 514 | |||
| Turgay deflection | 13-110 | 0.3-47.8 | 1.4-27.4 | 411 | |||
| Central Siberia | 4-430 | 0.5-65.6 | 1.6-28.8 | 587 | |||
| China | 100 | 18.0 | 19.0 | 1 | |||
| 20 | 8.0-22.3 | 10.4-16.5 | 8 | ||||
| Japan | 49-120 | 9.2-60.9 | 14.1-35.7 | 11 | |||
| 22-33 | 9.0-24.3 | 9.5-16.6 | 7 | ||||
| Sub-total | 1880 | ||||||
| Plantations | |||||||
| West and Central Europe | 7-50 | 0.5-36.5 | 1.4-21.0 | 77 | |||
| Scandinavia | 5-143 | 1.2-37.1 | 2.1-25.6 | 196 | |||
| The Ukraine and Byelorussia | 8-90 | 2.1-42.9 | 2.2-34.7 | 1010 | |||
| European Russia | 6-78 | 1.5-30.1 | 1.8-32.6 | 160 | |||
| Turgay deflection | 9-50 | 0.4-21.7 | 1.4-16.2 | 215 | |||
| Central Siberia | 10-73 | 2.0-36.0 | 2.4-21.6 | 170 | |||
| Iraq | 24 | 15.8 | 7.4 | 1 | |||
| China | 17-25 | 4.0-12.0 | 3.3-10.8 | 8 | |||
| Japan | 3-53 | 1.7-39.1 | 2.0-18.7 | 108 | |||
| 5-34 | 4.6-11.4 | 4.7-7.6 | 12 | ||||
| Sub-total | 1967 | ||||||
Table 1.
Distribution of the 3847 sample trees by species, countries, regions, and mensuration indices
The joint analysis of different species is caused by the impossibility of growing the same tree species throughout Eurasia, as a result of which their areas within the genus are confined to certain ecoregions. These are substitutive or vicariate species that arose in cases of geologically long- standing separation of a once-continuous area under influence of climate traits (
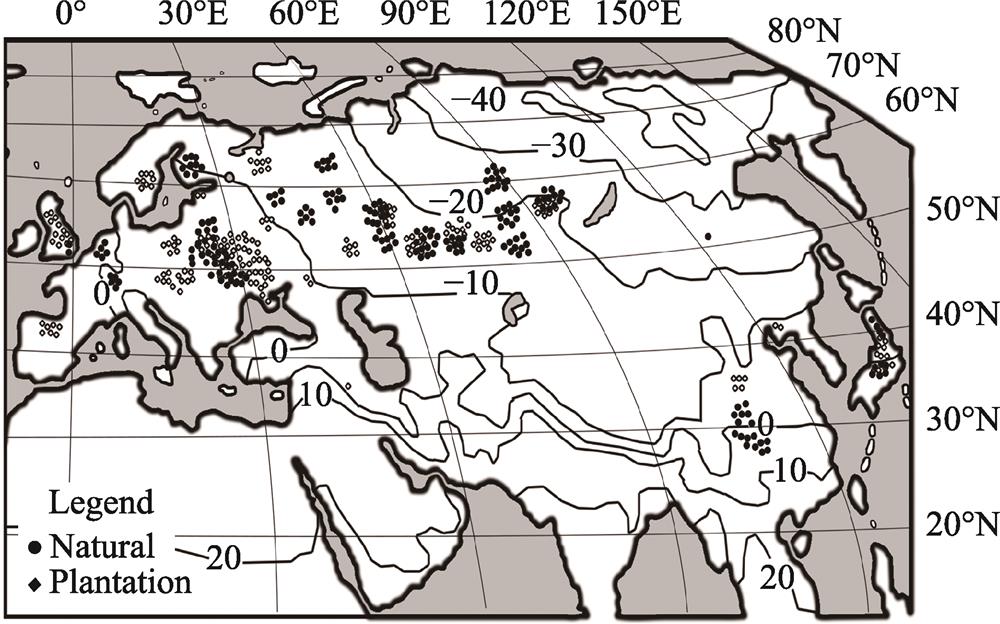
Each sample plot on which tree biomass estimating was performed is positioned relatively to the isolines of the mean January temperature and relatively to the isolines of mean annual precipitation (
![]()
Figure 1.Fig. 1
![]()
Figure 2.Fig. 2
It was found that when estimating stem biomass growth by using the annual ring width, the greatest contribution to explaining its variability being made by summer temperature accounting for from 16% of the total dispersion (
The final structure of the model includes only those mass-forming indices that are statistically significant for all biomass components, and it has the form (
where Pi is biomass of ith component, kg; A is tree age, yr; D is stem diameter at breast height, cm; H is tree height, m; i is the index of biomass component: stem over bark (Ps), foliage (Pf), branches (Pb) and aboveground (Pa); B is the binary variable that coordinates the biomass values of natural pines (B = 0) and pine plantations (B = 1); Т is mean January temperature, ℃; РR is mean annual precipitation, mm. Since the mean January temperature in the northern part of Eurasia has negative values, the corresponding independent variable is modified to be subjected to log-log procedure as T+40.
Along with the three main mass-forming variables i.e. tree age А, diameter D and height H of a tree, the product of two variables (lnD and lnH) is introduced as an additional predictor, the need for which was shown earlier (
3 Results
The regression coefficients of the multiple regression equation (1) are calculated using the Statgraphics software (see
| Regression model calculated | adjR2 | SE | |
|---|---|---|---|
| 0.987 | 1.24 | ||
| 0.900 | 1.61 | ||
| 0.926 | 1.66 | ||
| 0.986 | 1.24 |
Table 2.
Characteristics of regression model (1) calculated
The results of tabulating the equation (1) represent a rather cumbersome table. We took from it the calculated data of component biomass for the age of 50 years, D equal to 14 cm and H equal to 13 m and built 3D-graphs of their dependence on temperature and precipitation (
![]()
Figure 3.Fig. 3
Since the number of trees with measured underground biomass is 7 times less than the number of trees that have a component composition of above-ground biomass, we risk getting fake patterns that logically contradict (do not correspond) to the patterns shown in
where R and S are underground and aboveground biomass, respectively. The graphical interpretation of equation (2) is shown in
![]()
Figure 4.Fig. 4
4 Discussion
When analyzing the 3D-surfaces shown in
(1) With regard to stem biomass, we see that it increases with increasing precipitation in all temperature zones, as well as with increasing temperatures in areas of insufficient moisture. But as we move to areas of sufficient moisture, the last trend is modified.
(2) The biomass of needles and branches increases in cold zones as precipitation increases, as well as in areas of sufficient moisture as the temperature decreases. But as we move to areas of insufficient moisture and warm regions, these trends change.
(3) Aboveground biomass sums up component-specific patterns in itself, amplifying the coincident ones and neutralizing (compensating) the contradictory ones. In cold areas there is significant increase with increasing precipitation, but in the transition to the warm zone this trend disappears. In moisture-rich regions, the biomass increases as the temperature decreases, but in water-deficient regions, the pattern changes to the opposite trend.
Turning to the analysis of differences in the biomass trends of natural and plantation trees according to the second stage, it should be noted that, judging by the structure of the calculated equation (1), these differences are related only to changes in temperatures, but not precipitation, since the synergism B(lnPR) was not statistically significant. Our assumption of different age dynamics of the tree biomass of natural and artificial stands is also not confirmed, since the predictor B(lnA) is not statistically significant. The biomass of all components of plantation trees is higher than that of natural ones, but the percentage of this excess is different for all components and changes at different rates in relation to changes in temperature. Changes in the excess of biomass components of plantation trees above natural ones are shown in
| Biomass component | Mean temperature in January (℃) | ||||||
|---|---|---|---|---|---|---|---|
| -20 | -16 | -12 | -8 | -4 | 0 | 4 | |
| Stems | 1.3 | 2.2 | 3.0 | 3.7 | 4.3 | 4.8 | 5.3 |
| Foliage | 27.7 | 23.1 | 19.1 | 15.4 | 12.0 | 8.8 | 5.9 |
| Branches | 4.8 | 4.2 | 3.6 | 3.2 | 2.8 | 2.5 | 2.1 |
| Aboveground | 6.3 | 5.2 | 4.3 | 3.5 | 2.8 | 2.1 | 1.5 |
Table 3.
Changes in the excess percentage (%) of different components biomass of plantation trees above natural ones due to changes in January temperature
We can see that as we move from cold zones to warm ones, the excess of plantation tree biomass over natural ones increases from 1.3% to 5.3% for stem biomass, decreases from 27.7% to 5.9% for foliage biomass, as well as from 4.8% to 2.1% and from 6.3% to 1.5% for branches and aboveground biomass respectively, regardless of the precipitation level.
However, the most interesting question is how much the structure of forest biomass will change with an assumed temperature deviation, for example, by 1 ℃ and with a deviation of precipitation from the usual norm, for example, by 100 mm per year. The constructed model gives the answer to such question in relation to forest trees. To do this, we take the first derivative of our 3-Dimensional surfaces (
In this case, the differences between the biomass of natural and plantation trees become more obvious (
![]()
Figure 5.Fig. 5
(1) If the stem biomass of plantation trees increases when the temperature grows by 1 ℃ over the entire precipitation range from 300 to 900 mm (the entire 3D surface is located above the zero plane), then the biomass of natural trees - only in the range from 300 to 700 mm (located above the zero plane), and in the range from 700 to 900 mm it decreases (located below the zero plane).
(2) The foliage biomass in this case decreases over the entire range of precipitation from 300 to 900 mm, both in natural and plantation trees (the entire surface is located below the zero plane), but the percentage of decline in the latter is clearly greater than in the former.
(3) In terms of changing the branch biomass when the temperature assumes to increase by 1 ℃, natural and plantation trees do not differ much and show an increase in the precipitation range from 300 to 500 mm and a decrease in the range from 500 to 900 mm.
(4) When the temperature increases by 1 ℃, there is also a slight difference between natural and plantation trees in the change of aboveground biomass: the former increase in the precipitation range from 300 to 600 mm, and the latter - in the range from 300 to 500 mm only.
When annual precipitation assumes to be increased by 100 mm at constant January temperatures, the biomass of stems, branches and aboveground increases in all temperature zones, and the foliage biomass only in the range of temperature zones from -20 ℃ to -2 ℃, and the same for both natural and plantation trees (
![]()
Figure 6.Fig. 6
The similar modification of
![]()
Figure 7.Fig. 7
It is known, the solution of each new problem and the corresponding removal of the associated uncertainty generates several new ones. In our case, some uncertainties have arisen too:
(1) The patterns of biomass amount change under assumed changed climatic conditions (
(2) A disadvantage of the database used in this study is the uneven spatial distribution and different representation of sampling sites and natural and plantation trees over Eurasia (
(3) In equation (1), three mass-determining factors (A, D, and H) take upon himself the main share of the explained variance: for the masses of stems, needles, branches, and aboveground 94%, 86%, 91%, and 87%, respectively. Climate variables and differences between natural and plantation trees account for only 6% to 13% of the variability. The structure of these “residual” variables is highly variable and heterogeneous. In addition to the already noted uneven filling the initial data matrix, there are discrepancies between the age periods of mapping (
Taking into account the stated methodological and conceptual uncertainties, the results presented in this study provide a solution to the problem only in the first approximation and should be considered as preliminary ones and having not so much factual as methodological significance. They can be modified if the biomass database will be enlarged by additional data, mainly site-specific and stand-specific characteristics as well as by more advanced and correct methodologies.
5 Conclusions
When using the database compiled for natural and plantation single-trees, it is found that the aboveground and stem biomass of equal-sized and equal-aged natural and plantation trees increases as the January temperature and annual precipitation rise. This pattern is only partially valid for the branches biomass, and it has a specific character for the foliage one. The biomass of all components of plantation trees is higher than that of natural trees, but the percent of this excess varies among different components and depends on the level of January temperatures, but does not depend at all on the level of annual precipitation. As one moves from cold zones to warm ones, the excess of plantation tree biomass over natural ones increases from 1.3% to 5.3% for stem biomass, decreases from 28% to 6% for foliage biomass, as well as from 4.8% to 2.1% and from 6.3% to 1.5% for branches and aboveground biomass respectively, regardless of the precipitation level. As one moves from warm to cold zones, the absolute value of the root: shoot (R/S) ratio for thin trees (DBH = 8 cm) increases from 0.17 to 0.26, and for thick trees (DBH = 32 cm) from 0.13 to 0.20, but in percentage terms it does not depend on the stem thickness and increases by 48%. The results presented can be accounted for as the first approximation only.
References
[1] J Alcamo, M Moreno J, B Nováky et al. Europe: Impacts, adaptation and vulnerability. Contribution of working group ii to the fourth assessment report of the Intergovernmental Panel on Climate Change. In: Parry M L, Canziani O F, Palutikof, 4, 541-580(2007).
[2] М Antonov А. Comparison of indices of wood macrostructure in natural and artificial
[3] L Baskerville G. Use of logarithmic regression in the estimation of plant biomass. Canadian Journal of Forest Research, 2, 49-53(1972).
[5] B Bond-Lamberty, C Wang, T Gower S. Aboveground and belowground biomass and sapwood area allometric equations for six boreal tree species of northern Manitoba. Canadian Journal of Forest Research, 32, 1441-1450(2002).
[6] O Bouriaud, N Bréda, L Dupouey J et al. Is ring width a reliable proxy for stem-biomass increment? A case study in European beech. Canadian Journal of Forest Research, 35, 2920-2933(2005).
[7] G Brockerhoff E, H Jactel, A Parrotta J et al. Plantation forests and biodiversity: Oxymoron or opportunity?. Biodiversity and Conservation, 17, 925-951(2008).
[8] M Carrer, C Urbinati. Age-dependent tree-ring growth responses to climate in
[9] N Chernov N. On a ratio of natural and artificial reforestation in the Urals. Forests of the Urals and Their Management, 21, 210-219(2001).
[10] D Chernyshev V. Pathways of physiological and energetic adaptations of conifers under extreme conditions. In: Biological problems of the North: Abstract VI symp. Yakutsk: Institute of Biology, Yakutsk. Fil. Sib. Otd., 5, 13-17(1974).
[11] M Danchenko A, A Frickel Y, I Verzunov A. The formation of artificial young stands of white birch.. Tomsk, Tomsk Scientific Center:, 199(1991).
[12] L DeLeo V, L Menge D N, M Hanks E et al. Effects of two centuries of global environmental variation on phenology and physiology of
[14] A Detlaf T, A Detlaf A. Dimensionless criteria as a method of quantitative characterization of animal development. In: Mathematical biology of development, 25-39(1982).
[15] V Dokuchaev V. The theory of nature zones. Moscow: Geografgiz, 63(1948).
[16] C Dymond C, S Beukema, R Nitschke C et al. Carbon sequestration in managed temperate coniferous forests under climate change. Biogeosciences, 13, 1933-1947(2016).
[17] R Emanuel W, H Shugart H, P Stevenson M. Climate change and the broad scale distribution of terrestrial ecosystem complexes. Climate Change, 7, 29-43(1985).
[18] Global forest resources assessment 2005—Progress towards sustainable forest management.. FAO Forestry Paper 147, Rome, Italy, 320(2006).
[20] A Felton, U Nilsson, J Sonesson et al. Replacing monocultures with mixed-species stands: Ecosystem service implications of two production forest alternatives in Sweden. Ambio, 45, 124-139(2016).
[21] K Folland C, N Palmer T, E Parker D. Climate change 2001: The scientific basis. In: Houghton J T et al. (eds.). Contribution of Working Group I to the Third Assessment Report of the Intergovernmental Panel on Climate Change, 1032(2001).
[22] I Forrester D, H Tachauer I H, P Annighoefer et al. Generalized biomass and leaf area allometric equations for European tree species incorporating stand structure, tree age and climate. Forest Ecology and Management, 396, 160-175(2017).
[23] L Fu, W Sun, G Wang. A climate-sensitive aboveground biomass model for three larch species in northeastern and northern China. Trees, 31, 557-573(2017).
[24] N Gabeev V. Ecology and productivity of Scots pine forests.. Novosibirsk, Nauka:, 229(1990).
[26] J Givnish T. Adaptive significance of evergreen vs. deciduous leaves: Solving the triple paradox. Silva Fennica, 36, 703-743(2002).
[28] D Khan, A Muneer M, U Nisa Z et al. Effect of climatic factors on stem biomass and carbon stock of
[30] J Laing, J Binyamin. Climate change effect on winter temperature and precipitation of Yellowknife, Northwest Territories, Canada from 1943 to 2011. American Journal of Climate Change, 2, 275-283(2013).
[33] A Luganskiy N, V Shipitsina O. Comparative productivity of artificial and natural forests. Forest Bulletin, 3, 50-53(2008).
[34] H Lyr, H Polster, J Fiedler H. Woody physiology. Jena,. VEB Gustav Fischer publishing house, 444(1967).
[35] B Mackey. Counting trees, carbon and climate change. Significance, 11, 19-23(2014).
[36] A Makarenko A, P Biryukova Z. Productivity and stability of artificial forest stands in Northern Kazakhstan. In: Productivity and stability of forest ecosystems. (Abstracts of papers for the international symposium, 16-18 August, , 44(1982).
[37] D Merzlenko M. Actual aspects of artificial reforestation. Lesnoy Zhurnal (Proceedings of Higher Educational Institutions), 3, 22-30(2017).
[40] Е Nikitin K. Forest and mathematics. Forest Management, 5, 25-29(1965).
[41] A Niskanen. Forest plantations in the South: Environmental-economic evaluation. In: Palo M, Vanhanen H (eds). World forests from deforestation to transition? World forests, 2(2000).
[42] W Ochał, B Wertz, J Socha. Evaluation of aboveground biomass of black alder. In: Andrzej M. Jagodziński and Andrzej Węgiel (eds.). PoznańForest Biomass Conference 2013, 7-9 October 2013, Mierzęcin, Poland, 40(2013).
[43] P Odum E. Fundamentals of ecology. Moscow: “Mir” Publishing: 740. Translated from: Odum E P. 1971. Fundamentals of ecology (the third edition)(1975).
[45] N Polyakov A, F Ipatov L, V Uspensky V. Productivity of forest plantations. Moscow: Agropromizdat, 240(1986).
[46] Q Qiu, Q Yun, S Zuo et al. Variations in the biomass of
[48] M Romanov E, V Nureeva T, A Belousov A. The role of artificial stands of pine (
[49] I Rubtsov V, I Novoseltseva A, K Popov V et al. Biological productivity of Scots pine in forest-steppe zone. Moscow: Nauka, 223(1976).
[50] I Rukhovich D, I Pankova E, V Kalinina N et al. Quantification of the parameters of zones and facies of chestnut soils in Russia on the basis of the climatic-soil-textural index. Eurasian Soil Science, 52, 271-282(2019).
[51] S Schaphoff, O Reyer C P, D Schepaschenko et al. Tamm review: Observed and projected climate change impacts on Russia’s forests and its carbon balance. Forest Ecology and Management, 361, 432-444(2016).
[52] E Shelford V. Animal communities in temperate America as illustrated in the Chicago region: A study in animal ecology, 362(1913).
[54] R Stage A, L Renner D, C Chapman R. Selected yield tables for plantations and natural stands in Inland Northwest Forests. USDA Forest Service, Intermountain Research Station. Research Paper INT-, 394, 60(1988).
[55] C Stegen J, G Swenson N, J Enquist B et al. Variation in above-ground forest biomass across broad climatic gradients. Global Ecology and Biogeography, 20, 744-754(2011).
[56] I Tolmachev A. Fundamentals of plant habitat theory: Introduction to plant community chorology, 100(1962).
[57] L Tsel’niker Y. Structure of spruce crown. Russian Journal of Forest Science, 4, 35-44(1994).
[58] A Usoltsev V. Birch and aspen crown biomass in forests of Northern Kazakhstan. Bulletin of Agricultural Science of Kazakhstan, 4, 77-80(1972).
[61] A Usoltsev V, P Voronov M, V Azarenok M et al. Transcontinental additive allometric models and weight tables for estimating biomass of two-needled pine trees in natural forests and plantations. Agrarian Bulletin of the Urals, 165, 56-64(2017).
[62] A Usoltsev V, W Zukow, A Osmirko A et al. Additive biomass models for
[63] P Vanninen, H Ylitalo, R Sievänen et al. Effects of age and site quality on the distribution of biomass in Scots pine (
[65] (2007). https://www.mapsofworld.com/referals/weather.
[67] S Zeng W, Y Chen X, Y Pu et al. Comparison of different methods for estimating forest biomass and carbon storage based on National Forest Inventory data. Forest Research, 31, 66-71(2018).
[69] M Zolotukhin F. Comparative analysis of young Scots pine development of natural and artificial origin. Forest management, 2, 30-33(1966).


Set citation alerts for the article
Please enter your email address

© Copyright 2018-2021 | Chinese Laser Press. All Rights Reserved 沪ICP备15018463号-20