
Yangjin LI, Xian FAN, Guanfu LONG, Nanfeng ZHANG, Yanxi ZHANG, Deyong YOU, Xiangdong GAO. Spatter Dynamic Recognition and Feature Analysis During High-power Disk Laser Welding[J]. Acta Photonica Sinica, 2021, 50(2): 208
- Acta Photonica Sinica
- Vol. 50, Issue 2, 208 (2021)
Abstract
Keywords
0 Introduction
With fast heating process, minimal distortion by heat and great heat concentration, laser is one of the advanced machining technologies[
Many monitoring methods estimate weld quality, such as acoustic emission, optical signal, and temperature field evolution[
A type 304 austenitic stainless steel plate is taken as the testing object for the high-power disk laser bead-on-plate welding experiment. To extract instantaneous variation information of metal spatters to analyze spatter feature better, a high-speed camera is used to capture the ultraviolet band and visible light band spatter images of welding. Spatter feature parameters including centroid position, area, grayscale, average grayscale, and radius are extracted from each image after preprocessing. Spatter searching information database and similarity functions are established based on the spatter feature parameters. The spatters produced during and before time t could be distinguished by comparing the spatter similarity functions. The radius calculated the volume of the spatters produced at time t. The statistic of the volume and grayscale of the spatters of different welding areas, the proportion under different threshold, and the change of the weld seam width evaluated the welding quality.
1 Experimental setup
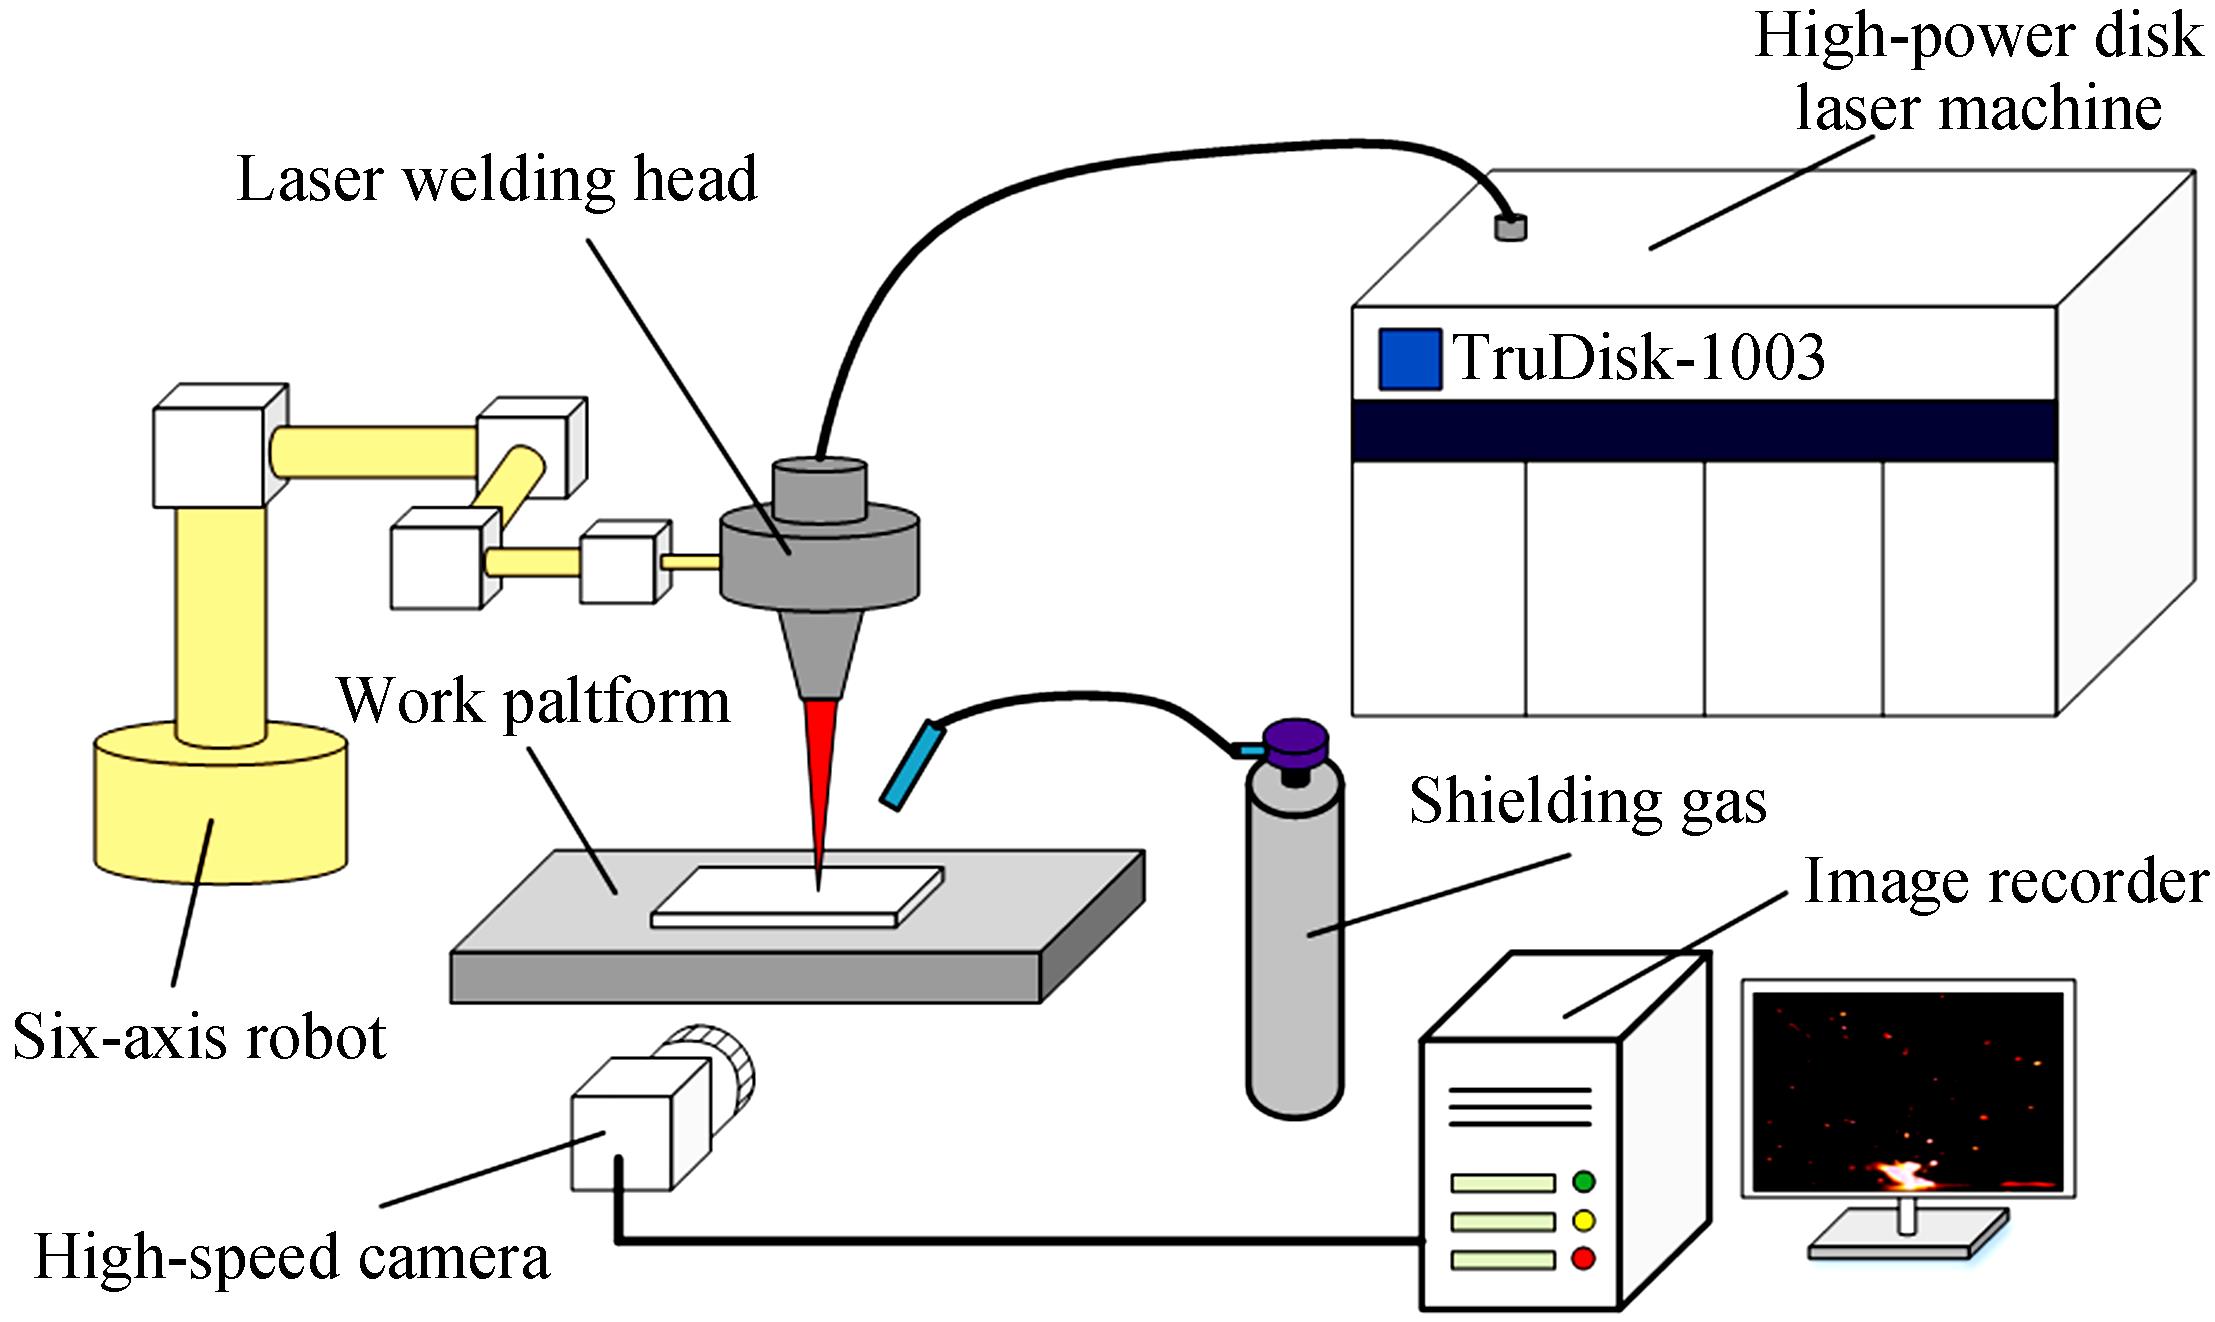
The experiment consists of a high-power disk laser TruDisk-10003 (10 kW), a Motoman 6-axis robot, a welding experimental platform, an NAC high-speed camera (2 000 f/s), a shielding gas (argon), and a type 304 austenitic stainless workpiece (150 mm×100 mm×20 mm). The diameter of the laser spot is 480 μm, the wavelength of the laser is 1 030 nm, and the welding speed is 4.5 m/min. The spectral band of the high-speed camera is 320~750 nm (ultraviolet + invisible light) [
![]()
Figure 1.High-power disk laser bead on plate welding
2 Spatter dynamic recognition
2.1 Main idea of dynamic recognition algorithm
After image preprocessing, the movement of the spatter could be estimated by comparing the spatter features of adjacent time in successive images. The continuous eight-image sequence is shown in Fig. 2. The schematic diagram of spatter recognition tracking is shown in Fig. 3. First, the spatter feature information of image for each time t is calculated and stored in . Second, the new spatters of is distinguished by comparing the differences of spatter feature information between and the searching information database . Finally, the information of these new spatters is saved into the new spatter database , and the corresponding values of the spatters in are updated[
![]()
Figure 2.Eight frames of consecutive spatter images
![]()
Figure 3.Schematic diagram of spatter recognition
2.2 Definition of spatter features
All spatter feature information of at time t is stored in . To obtain accurate spatter features and eliminate metal plumes, the spatter images are preprocessed[
where is the grayscale of pixel of spatter image I at time t, represents the covering area of spatter j at time t, represents the pixel numbers of the covering area of spatter j at time t, and represents the edge of the covering area of spatter j at time t.
A residual of the peripheral vision of moving spatters is collected in the experiment because of the camera"s high-speed shooting (2 000 f/s). The spatters detected in the spatter image are mainly round and rod shaped. But the original entity of the spatter is similar to a sphere. The spatter radius is the minimum distance of the edge to the centroid of the spatter, as shown in Fig. 4. The red line is the shape of the spatter detected in the spatter image. The yellow line is the original entity shape of the spatter, and the blue line is the spatter radius.
![]()
Figure 4.Definition of spatter radius
2.3 Creation of spatter searching information database
To recognize the spatter produced at time t, the spatter searching information database and similarity functions are established. Table 1 lists the information of , where and v is the number of spatters. The information for each spatter detected for the first time is saved into , defined as the initial spatter information, and is then replaced with new information if another one is detected. The current information keeps on updating until the spatter disappears[
| u | Searching information database |
|---|---|
| 1 | Centroid abscissa x of initial spatter |
| 2 | Centroid ordinate y of initial spatter |
| 3 | Centroid ordinate y of initial spatter |
| 4 | Grayscale of initial spatter |
| 5 | Average grayscale of initial spatter |
| 6 | Radius of initial spatter |
| 7 | Speed of initial spatter |
| 8 | Variation of centroid abscissa x |
| 9 | Variation of centroid ordinate y |
| 10 | Number of initial spatter image frames |
| 11 | Centroid abscissa x of current spatter |
| 12 | Centroid ordinate y of current spatter |
| 13 | Area of current spatter |
| 14 | Grayscale of current spatter |
| 15 | Average grayscale of current spatter |
| 16 | Radius of current spatter |
| 17 | Speed of current spatter |
| 18 | Direction of spatter |
| 19 | Number of times the spatter appeared |
| 20 | Number of times the spatter disappeared |
Table 1. Information of spatter searching data-base
The spatter feature information of the is calculated and stored in the by detecting the spatters in a continuous image sequence. Then the new spatters of are distinguished by comparing the different spatter feature information of and . The information of these new spatters in the searching information database is updated to recognize the new spatters.
2.4 Calculation of spatter direction and searching region
Spatters are distributed in different areas in the welding image because it erupts toward different directions in laser welding. Some spatters fall from the top of the shooting area. Therefore, different calculations of the direction angle should be considered[
![]()
Figure 5.Definition of spatter direction
The ,, and the angle of spatter direction in Fig. 5 are defined as
If , namely ,
If ax≥0 & ay≥0, namely ,
If ax≥0 & ay<0, namely ,
To improve the recognition efficiency and accuracy, the spatter velocity and direction are used to calculate the spatter searching region. Spatter moving distance L is defined as the product of spatter velocity and moving time t (adjacent to image time interval 0.5 ms). The spatter searching region is a rectangle whose side length is 12 pixels larger than L in the axis projection, as shown in Fig. 6. If the velocity is zero, the searching region is a square with the spatter centroid as the center, whose side length is 60 pixels.
![]()
Figure 6.Definition of searching region
2.5 Establishment of spatter similarity function and dynamic recognition algorithm
To determine whether the spatters in different images are new or old, the spatter shape similarity function is established based on spatter area, grayscale, and average grayscale. The angle similarity function is established based on spatter direction angle . Their computational formulas are shown as[
where is the spatter direction angle.
The new position and feature parameters of a spatter could be predicted by comparing the shape similarity function with the angle similarity function of the spatter produced prior to time t and adding its new information to the searching information database. Through experimental comparison, set threshold S of to 0.4 and set threshold A of to П/12. If spatters in and could meet the similar condition , they are considered to be the same, and the corresponding items of the spatter in the searching information database are updated, which is shown in Eq. (14). and are the variations of spatter centroid abscissa x and centroid ordinate y. There are six feature information of the current spatter from to . is the velocity of the current spatter, which is equal to distance divided by time. is the spatter direction calculated by Eqs. (7)~(11). represents the times that a spatter appears. It is increased when a spatter is currently detected again.
If ,
If spatters in and could not meet the same condition, the spatter disappears or is currently overlapped by other spatters (because of the camera can only shoot two-dimensional graphics). However, it is entirely possible to occur at the next moment, so the trajectory prediction should be taken. The corresponding items of the spatter in the searching information database are updated[
If ,
and are the centroid abscissa x and centroid ordinate y, respectively. The variation of centroid coordinate is needed to calculate them since the spatter has not been detected at this time. represents the times of disappearance. It increases when a spatter has currently disappeared and determines whether the spatter is new.
After the spatter searching, if spatter j in is not similar to any spatter in , it is considered to be the first detected spatter at time t. The information (l=1, …, m, where m is the number of spatters first detected at time t) is stored in the searching information databasewith the corresponding initial value. The computational formulas of assignment and renewal are shown in Eq. (16). means the number of initial spatter image frames, that is, the time of obtaining the initial spatter image. represents the times that the spatter appeared. It is assigned as 1 since the spatter is detected first. The initial value of the rest of the spatter information in is 0.
The spatter eruption situation is so complex that some special issues should be considered, such as the spatter appearing on the border of image and irregular metal plumes and other noise information occurring in welding. The spatter is not a new one if it appears on the border. It needs to be dealt with by setting the starting point coordinate boundary conditions, as shown in Eq. (17). Irregular metal plumes (halo) and noise information could be dealt with by setting the terminal point coordinate border conditions, which are shown in Eq. (18). If both and could meet the boundary conditions of the starting point coordinate, the spatter is identified as a falling spatter or interference noise rather than a new one[
By experimental comparison, set the spatter occurrence frequency threshold Neto 6 to filter the noise information of spatter images. If the spatter occurrence frequency with special treatment, a new spatter is produced at time t,and its information is saved to the new spatter database , where r isthe number of new spatters and h is the characteristics of the new spatter. To improve the recognition efficiency and avoid spatter searching information overloading, when spatter disappear frequency is greater than 10, the spatter information should be removed. The flowcharts of spatter recognition algorithm and spatter recognition effect are shown in Figs. 7 and 8, respectively.
![]()
Figure 7.Flow chart of spatter recognition algorithm
![]()
Figure 8.Spatter recognition effect
3 Statistic analysis of spatter characteristic
Laser welding is physical reaction with dramatic changes in energy, in which the metal plumes greatly influence the laser beam by absorbing, refracting, and reflecting it. The periodic variation of metal plumes will lead to the periodic variation of absorbing the laser energy. The width of the welding seam will also change in varying degrees, so dividing the welding seam in regions to analyze the relationship between the spatter feature parameters and the welding quality better is necessary. Region division and the corresponding width of the welding seam are shown in Fig. 9.
![]()
Figure 9.Regionalism curve of weld seam width
Welding quality and stability can be reflected by the width of the welding seam, obviously, the welding seams of regions A and C are wider and more stable than that of region B. Hence, the welding quality of region B is the worst, and regions A and C seem better. The feature parameters of new spatters can be extracted after spatter dynamic recognition, such as number, radius, volume, speed, direction angle, area, and grayscale. Therefore, this test studies these three representative regions to explore the relationship between spatters and welding quality.
The sphere volume formula calculates the volume of spatters produced at time t, which is shown in Eq. (19). The volume and grayscale of new spatters are shown in Fig. 10, both of them representing the summation of all the new spatters produced at any time.
where V(t) is the volume of spatters produced at time t, n is the number of spatters produced at time t and Rkis the spatter radius of the corresponding k spatter.
![]()
Figure 10.Volume and grayscale of spatters
The statistics of spatter volume and grayscale for these three regions are shown in Tables 2 and 3, respectively. Both the summation and the proportion based on the different threshold of the spatter's volume and grayscale of region B are greater than others. According to the above analysis, when the width of the weld seam suddenly becomes small, the volume and grayscale of spatter in the welding experiment will increase correspondingly. The width of weld seam usually fluctuates within a certain range. If the changing amplitude of weld width exceeds certain threshold, a poor weld formation can be determined.
| Image sequence F | Spatter volume/pixel | Proportion of volume greater than 1 000 | Proportion of volume greater than 500 |
|---|---|---|---|
| A(601~800f) | 19 482 | 1% | 6.5% |
| B(1101~1300f) | 32 376 | 3.5% | 9% |
| C(1801~2000f) | 28 580 | 2.5% | 7.5% |
Table 2. Statistic of spatter volume of A, B, C regions
| Image sequence F | Spatter grayscale | Proportion of grayscale greater than 35 000 | Proportion of grayscale greater than 20 000 |
|---|---|---|---|
A(601~800f) B(1 101~1 300f) C(1 801~2 000f) | 1 539 800 2 195 000 1 916 100 | 2.5% 6.5% 3% | 10.5% 17.5% 16% |
Table 3. Statistic of spatter grayscale of A, B, C regions
4 Conclusions
The instantaneous information of spatters could be captured by using a high-speed camera during high-power disk laser welding. Experimental results showed that the spatters produced during the welding experiment could be accurately detected using the proposed spatters recognition algorithm after preprocessing. The feature parameters of the spatters could be accurately extracted and calculated. The width of region B dramatically decreased in the middle area of the welding seam. Thus, the welding quality of region B was the worst. The volume and grayscale of region B were greater than others by comparing the weld seam width with the spatter feature information, which shows that the spatter feature information and the welding quality are closely related. Under normal circumstances, the weld width would be reduced correspondingly when the volume and the grayscale of the spatter increased in the process of laser welding. Therefore, the volume and grayscale the of the spatter could be used to effectively quantify information and evaluate welding quality. They greatly reflect the real-time quality of laser welding.
References
[1] Qibiao YANG, Hong ZHANG, Wei ZHOU et al. Surface incubation effect of carbide yg6 induced by femtosecond laser. Acta Photonica Sinica, 48, 614002(2019).
[2] Junzhan ZHANG, Yuanmin ZHANG, Yongsheng LIU et al. Femtosecond laser ablation properties of ZrO2 and Al2O3 ceramics at linear and circular polarized light. Acta Photonica Sinica, 47, 614003(2018).
[3] Shi SU, Zhiyong AN, Wei LIANG et al. Comparisons and analysis of drilling experiment using different pulse laser wavaforms. Acta Photonica Sinica, 41, 565-570(2012).
[4] Fei CHANG, Jian ZHANG, Yunchao XIE et al. Fabrication, characterization, and photocatalytic performance of exfoliated g-C3N4-TiO2 hybrids. Applied Surface Science, 311, 574-581(2014).
[5] Xiangdong GAO, Yanxi ZHANG. Monitoring of welding status by molten pool morphology during high-power disk laser welding. Optik-International Journal for Light and Electron Optics, 126, 1797-1802(2015).
[6] A HEIDER, J SOLLINGER et al. High-speed X-ray analysis of spatter formation in laser welding of copper. Physics Procedia, 41, 112-118(2013).
[7] Y OKAMOTO, H YAMAMOTO, A OKADA et al. Velocity and angle of spatter in fine laser processing. Physics Procedia, 39, 792-799(2012).
[8] Yu GAN, Wenxian WANG, Zeqin CUI et al. Numerical and experimental study of the temperature field evolution. Optik-International Journal for Light and Electron Optics, 126, 739-743(2015).
[9] M J ZHANG, G Y CHEN, Y ZHOU et al. Observation of spatter formation mechanisms in high-power fiber laser welding of thick plate. Applied Surface Science, 280, 868-875(2013).
[10] M SIMONELLI, C TUCK, N T ABOULKHAIR et al. A study on the laser spatter and the oxidation reactions during selective laser melting of 316l stainless steel, Al-Si10-Mg, and Ti-6Al-4V. Metallurgical and Materials Transactions A-Physical Metallurgy and Materials Science, 46, 3842-3851(2015).
[11] Xinmiao XIA, Zhaoliang JIANG, Pengfei XU. A detection algorithm of spatter on welding plate surface based on machine vision. Optoelectronics Letters, 15, 52-56(2019).
[12] P Y SHCHEGLOV, A V GUMENYUK, I B GORNUSHKIN et al. Vapor–plasma plume investigation during high-power fiber laser welding. Laser Physics, 23, 16001(2012).
[13] Huang WEI, K RADOVAN. A laser-based vision system for weld quality inspection. Sensors, 11, 506-521(2011).
[14] Kai LI, Hongming GAO, Haichao LI et al. Droplet rebounded spatter in dry hyperbaric gas metal arc welding process. International Journal of Advanced Manufacturing Technology, 74, 693-698(2014).
[15] P Y SHCHEGLOV, S A USPENSKIY, AV GUMENYUK et al. Plume attenuation of laser radiation during high power fiber laser welding. Laser Physics Letters, 8, 475-480(2011).
[16] D COLOMBO, B M COLOSIMO, B PREVITALI. Comparison of methods for data analysis in the remote monitoring of remote laser welding. Optics & Lasers in Engineering, 51, 34-46(2013).
[17] Bin CAO, Yuanpeng XIANG, Xiaoqing LV et al. Approximate entropy-a new statistic to quantify arc and welding process stability in short-circuiting gas metal arc welding. Chinese Physics B, 17, 865-879(2008).
[18] J POWELL, A F H KAPLAN. Spatter in laser welding. Journal of Laser Applications, 23, 1-7(2011).
[19] M SCHWEIER, J F HEINS, M W HAUBOLD et al. spatter formation in laser welding with beam oscillation. Physics Procedia, 41, 20-30(2013).
[20] Ye HUANG, Xueming HUA, Fang LI et al. Spatter feature analysis in laser welding based on motion tracking method. Journal of Manufacturing Processes, 55, 220-229(2020).
[21] A K PULHANI, B M SURI et al. Time-resolved emission spectroscopic study of laser-induced steel plasmas. Plasma Science and Technology, 15, 546(2013).
[22] Xiangdong GAO, Yan SUN, S KATAYAMA. Neural network of plume and spatter for monitoring high-power disk laser welding. International Journal of Precision Engineering and Manufacturing-Green technology, 1, 293-298(2014).
[23] Guanfu LONG. Analysis of characteristics of spatters during high-power disk laser welding(2012).

Set citation alerts for the article
Please enter your email address
© Copyright 2018-2021 | Chinese Laser Press. All Rights Reserved 沪ICP备15018463号-20