
Zhenkun Liang, Xiao Li, Zhibin Wang, Kewu Li, Xiaoyang Zang. Photo-Elastic Modulation Based on Adaptive Regulation of Driving Voltage[J]. Chinese Journal of Lasers, 2021, 48(11): 1104001
- Chinese Journal of Lasers
- Vol. 48, Issue 11, 1104001 (2021)
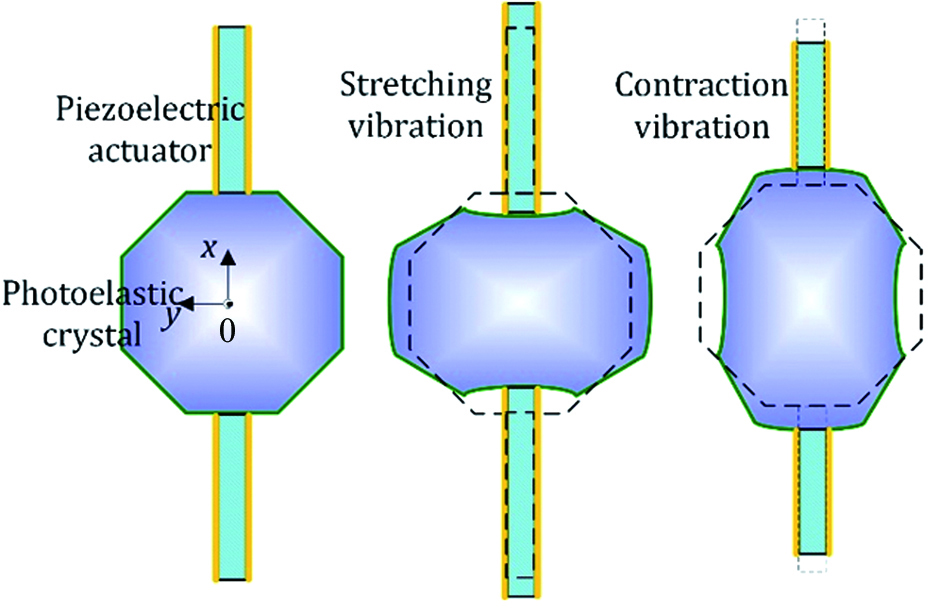
Fig. 1. Vibration model of PEM
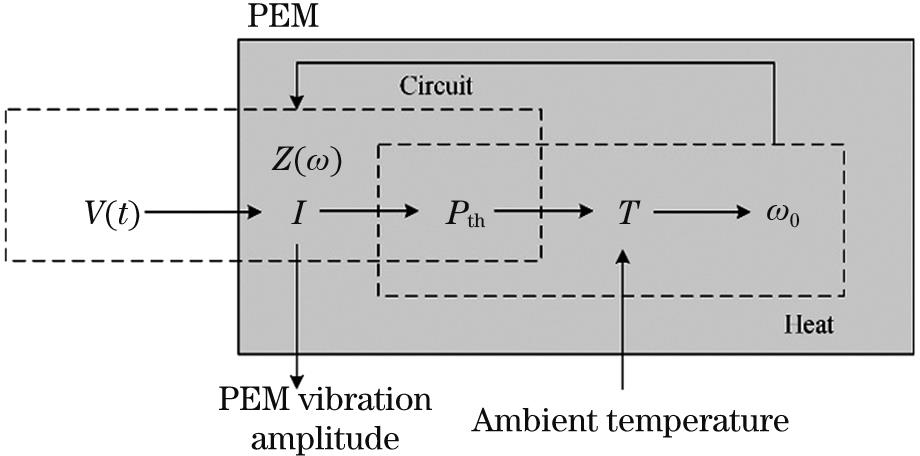
Fig. 2. Dynamic heat exchange model of PEM
Fig. 3. Diagram of system light path
Fig. 4. J4/J2 varying with δ0
Fig. 5. Duty cycle closed loop control system
Fig. 6. Flow chart of stability control system of PEM
Fig. 7. Test platform for stability control system of PEM
Fig. 8. Frequency sweep result
Fig. 9. Waveforms of driving square wave, driving voltage, and interference modulation signal, and relationship between duty cycle and driving voltage. (a) Waveforms of driving square wave, driving voltage, and interference modulation signal; (b) relationship between duty cycle and driving voltage
Fig. 10. Amplitude of phase modulation
Fig. 11. Phase modulation amplitude varying with time at 1/2 wave state, and PEM phase modulation without feedback. (a) Phase modulation amplitude varying with time; (b) PEM phase modulation without feedback
Fig. 12. Phase modulation amplitude varying with time at 1/4 wave state
|
Table 1. Comparison of PEM control accuracy

Set citation alerts for the article
Please enter your email address
© Copyright 2018-2021 | Chinese Laser Press. All Rights Reserved 沪ICP备15018463号-20