Hao Tu, Lixia Xi, Xiaoguang Zhang, Xia Zhang, Jiachuan Lin, Wan Meng, "Analysis of the performance of optical frequency comb based on recirculating frequency shifter influenced by an Er-doped fiber amplifier," Photonics Res. 1, 88 (2013)
Copy Citation Text
The factors that influence the generation of a high-quality optical frequency comb (OFC) based on a recirculating frequency shifter (RFS) due to the maximum output power and noise figure of Er-doped fiber amplifier (EDFA) are studied theoretically and experimentally. Based on the theoretical analysis, numerical simulations and experiments under different EDFA parameters have been carried out. The results show that the performance of the OFC based on a RFS can be improved effectively by optimizing the maximum output power and the noise figure of the EDFA.
In order to achieve the terabit high-speed optical transmission for the sharp increase in the capacity for data communication, various technologies have been investigated in recent years [1–3]. The optical frequency comb (OFC) is one of the crucial components in these technologies. There are several methods for OFC generation, including supercontinuum technology [4], cascaded phase modulators and intensity modulators [5], cascaded phase modulators based on recirculating frequency shifters (RFSs) [6,7], single-sideband modulators based on RFSs [8–13]. Compared with others methods, the last method presents many advantages, such as a low radio-frequency (RF) driving voltage, controllability of carrier frequency spacing, and a good ability to achieve a large number of shifted carriers. However, the flatness and tone-to-noise ratio (TNR) of OFCs based on RFSs are strongly influenced by the maximum output power and noise figure of Er-doped fiber amplifiers (EDFAs). Therefore, investigating the properties of the EDFA that influence the OFC is important.
In our previous work [8,9] we analyzed the performance of the OFC based on an RFS influenced by several factors but without considering the factors of maximum output power and noise figure of the EDFA. In this paper, we theoretically and experimentally analysis the influence due to the maximum output characteristics and noise figure of the EDFA on the output quality of the OFC based on an RFS. The results show that the properties of the EDFA are critical factors that affect the quality of the OFC.
2. THEORETICAL ANALYSIS
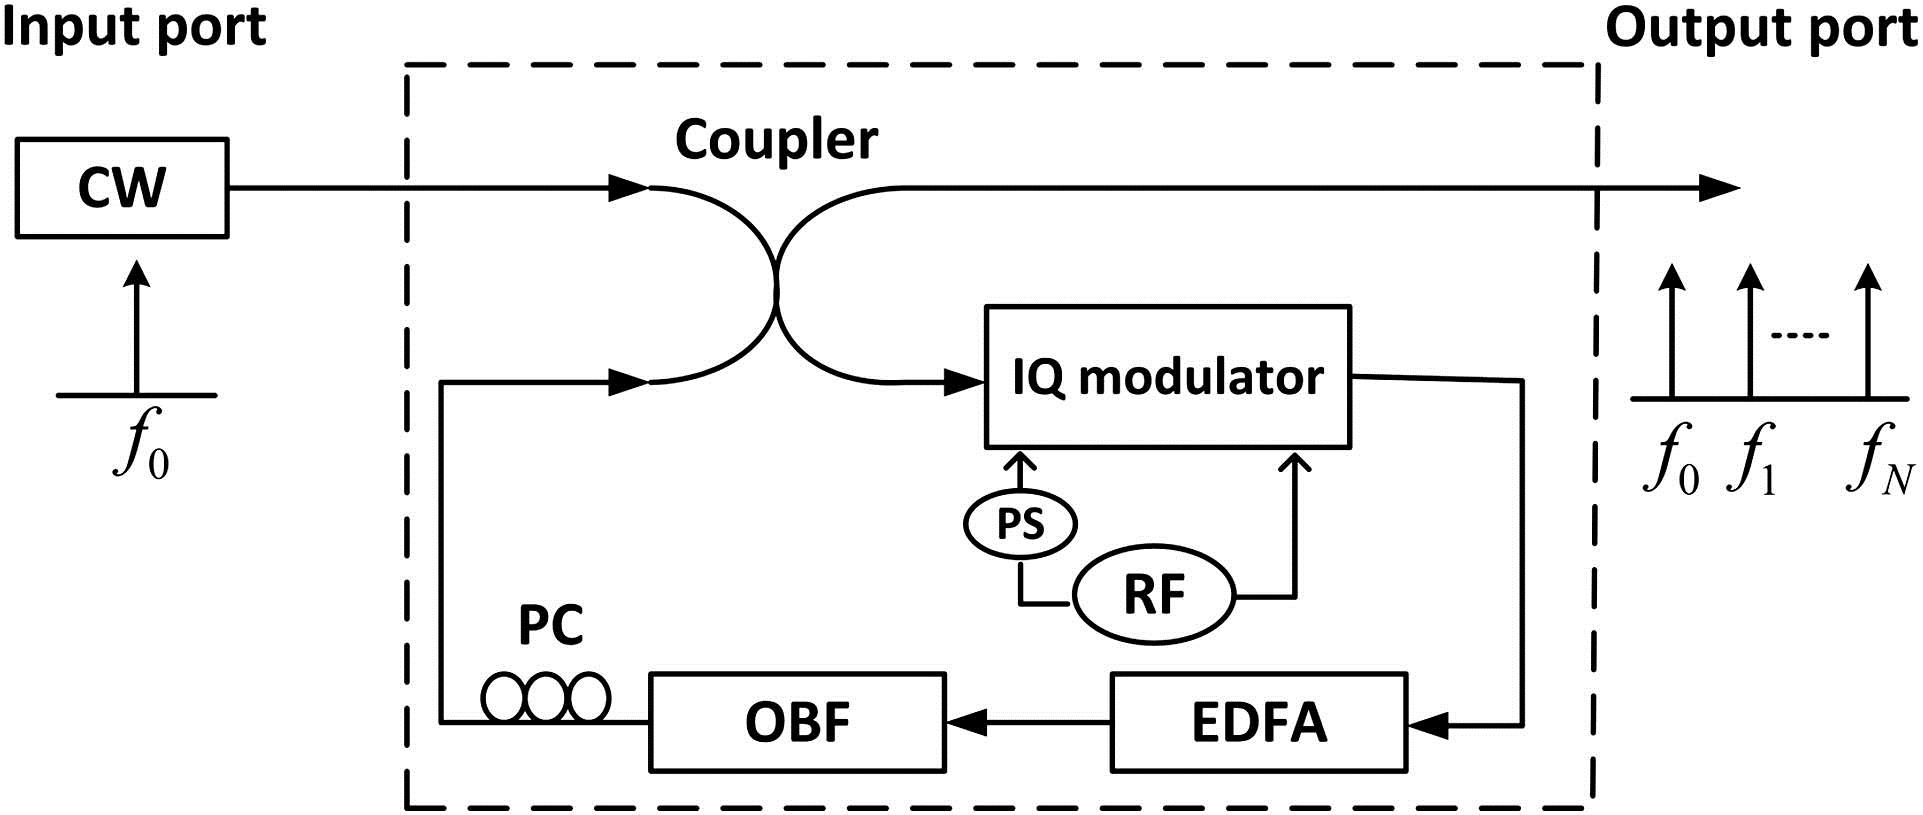
The schematic of the OFC based on an RFS is shown in Fig. 1. A CW laser is used as the seed light source, an in-phase/quadrature (I/Q) modulator is used to induce a frequency shift in the seed light, an EDFA is used to compensate for the total losses, and a polarization controller (PC) is used to control the polarization state of the light.
Sign up for Photonics Research TOC. Get the latest issue of Photonics Research delivered right to you!Sign up now
We represent the input signal as ; assuming that the polarization state of light is linear and stable, the output electronic field after () round trips [8] can be given by where is the transfer function of the I/Q modulator; stands for the cross-talk coefficient, which depends on the modulator drive voltage; denotes the phase delay per round trip; and represent the gain and the amplified spontaneous emission (ASE) noise of the EDFA in the th round trip, respectively, and represents the total losses [10].
A. Relationship between Maximum Output Power of EDFA and Flatness of OFC
Equation (1) shows that the power of the shifted carrier is determined by the result of . When , we can obtain an OFC with an excellent flat output spectrum. When and , the power of the shifted carrier will be lower or higher than the power of the seed light, respectively, and lead to a significant peak power difference.
The gain of the EDFA can be expressed as [14]where represents the desired number of carriers and and represent the gain and the small-signal gain of the EDFA, respectively, is the input power of the EDFA, is the maximum output power of the EDFA, is a parameter that characterizes the saturation (we set ), and is the power of a single carrier. Apparently, the gain of the EDFA increases as and increase; they depend mainly on the desired number of tones and the pump power of the EDFA, respectively.
We performed a numerical simulation of the generation of 60 carriers. The dependence of the peak power difference on the maximum output power is shown in Fig. 2. It is clear that the figure can be divided into three regions, in which the value of is approximately unity, larger than unity, and less than unity. In the region of , the peak power difference reaches a minimum, which means the output spectrum of the OFC is flat. In regions of either or , flat spectra of the OFC cannot be achieved.
Figure 2.Relationship between maximum output power and peak power difference.
B. Relationship between Noise Figure of EDFA and TNR of OFC
Assume that ; the output of the loop can be written as where the first term of Eq. (4) represents the desired frequency-shifted signals, while the second term represents the noise components. Equation (4) shows that the ASE noise is accumulated round by round. To describe the effect of ASE noise, we discuss the worst TNR of shifted carriers and theoretically analyze the relationship between ASE noise (generally the noise figure is used to account for the ASE noise) and the worst TNR.
The TNR for each single shifted carrier can be expressed as where and represent the powers of the signal and the ASE noise of the th shifted carrier, respectively.
The power of the shifted carriers is equal to the power of the seed light:
Assume that the noise figure of the EDFA is constant, and use a cascaded model to describe it as follows:
For a single shifted carrier, the ASE noise can be expressed as [15]where NF is the noise figure of the EDFA, represents the energy of the photon, and is the bandwidth of a single shifted carrier. ASE noise for a shifted carrier can be written as
Equation (9) shows that the noise figure determines , and with an increasing number of carriers, the power of ASE noise will increase dramatically. To verify the theoretical analysis, the relationship between the number of carriers and the worst TNR is shown in Fig. 3. Figure 3 shows that the worst TNR decreases when the noise figure increases. For example, when we need to generate 60 carriers with the worst TNR larger than 20 dB, we should optimize the noise figure of the EDFA to be smaller than 5.5 dB. It is very hard to achieve the desired number of carriers if the noise figure of the EDFA cannot meet the requirement.
Figure 3.Relationship between noise figure of EDFA and worst TNR.
In the experiment, the output power of the CW laser is 12 dBm and the center wavelength is 1549.916 nm. The frequency of the RF drive signal is 12.5 GHz. Most of the components were polarization sensitive except the EDFA, so a PC is used. The insertion loss of the I/Q modulator, filter, and coupler are about 13, 3, and 3 dB, respectively.
To study the changes of the carrier flatness with different output characteristics, we adjust the EDFA to realize the OFC with different maximum output powers. The results are shown in Fig. 4. We set the maximum output power at Fig. [4(a)] 23 dBm, [4(b)] 24 dBm, [4(c)] 25 dBm, [4(d)] 26 dBm, [4(e)] 27 dBm, and [4(f)] 28 dBm, respectively.
Figure 4.Output spectrum varies with different maximum output power of EDFA: (a) 23, (b) 24, (c) 25, (d) 26, (e) 27, and (f) 28 dBm.
Moreover, the ASE noise is one of the crucial factors that influence the TNR of the OFC. We changed the bandwidth and the center frequency of the bandpass filter to get different numbers of carriers and measure the worst TNR. The noise figure of the EDFA is 5.5 dB in our experiment. Figure 5 shows the relationship between the worst TNR and the number of carriers according to the experimental results. It is shown that the worst TNR is 23.6, 22, and 20.3 dB, respectively, when 30, 43, and 60 carriers are generated. The worst TNR becomes lower with an increased number of carriers, which is due to the accumulation of ASE noise. From the theoretical results shown in Fig. 3, we can see that when the noise figure is 5.5 dB, the worst TNR is 23.4, 22.1, and 20.2 dB, respectively, when 30, 43, and 60 carriers are generated. With the comparison of Fig. 3 and Fig. 5, it is clear that the theoretical analysis is in good accordance with the experiment.
Figure 5.Worst TNR varies with different numbers of carriers.
The flatness and TNR of the OFC that depend on the maximum output power and noise figure of the EDFA are theoretically analyzed and simulated; experimental verification is also performed. The results indicate that, by adjusting the range of maximum output power and the noise figure of the EDFA, OFC output performance will be improved, which can provide an important theoretical guide to improve the OFC output quality, and make OFCs based on RFSs useful in next-generation terabit communication systems.
References
[1] Y. Ma, Q. Yang, Y. Tang, S. Chen, W. Shieh. 1Tb/s per channel coherent optical of dm transmission with subwavelength bandwidth access. Optical Fiber Communication Conference and National Fiber Optic Engineers Conference, PDPC1.1-3(2009).
[3] X. Liu, S. Chandrasekhar, B. Zhu, D. Peckham. Efficient digital coherent detection of a 1.2Tb/s 24-carrier no-guard-interval CO-OFDM Signal by simultaneously detecting multiple carriers per sampling. Optical Fiber Communication Conference, OWO2(2010).
[4] V. Ataie, B. P.-P. Kuo, E. Myslivets, S. Radic. Generation of 1500-tone, 120 nm-wide ultraflat frequency comb by single CW source. Optical Fiber Communication Conference/National Fiber Optic Engineers Conference 2013, PDP5C.1(2013).
Hao Tu, Lixia Xi, Xiaoguang Zhang, Xia Zhang, Jiachuan Lin, Wan Meng, "Analysis of the performance of optical frequency comb based on recirculating frequency shifter influenced by an Er-doped fiber amplifier," Photonics Res. 1, 88 (2013)