• Resources Science
  • Vol. 42, Issue 3, 517 (2020)
Jun ZHAI1、1, Diandian JIN1、1, Yan CHEN1、1, Xin LIU2、2, Xu YANG1、1, Peng HOU1、1, and Yanda XU3、3、*
Author Affiliations
  • 1.Ministry of Ecology and Environment Center for Satellite Application on Ecology and Environment, Beijing 100094, China
  • 1.生态环境部卫星环境应用中心,北京 100094
  • 2.Information Center of Ministry of Ecology and Environment, Beijing 100029, China
  • 2.生态环境部信息中心,北京 100029
  • 3.Ministry of Ecology and Environment of the People’s Republic of China, Beijing 100006, China
  • 3.生态环境部,北京 100006
  • show less
    DOI: 10.18402/resci.2020.03.10 Cite this Article
    Jun ZHAI, Diandian JIN, Yan CHEN, Xin LIU, Xu YANG, Peng HOU, Yanda XU. Ecological changes, problems and countermeasures in the High Efficiency Eco-economic Zone of the Yellow River Delta[J]. Resources Science, 2020, 42(3): 517 Copy Citation Text show less
    研究区地理位置图Figure 1
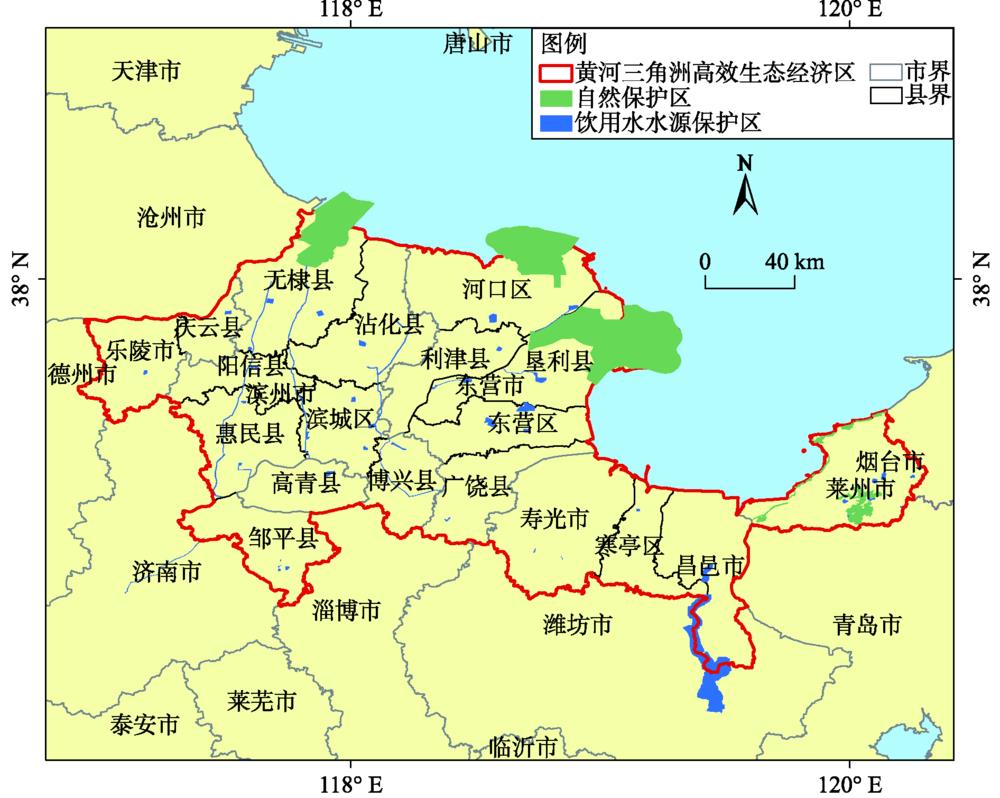
    Fig. 1. 研究区地理位置图Figure 1
    1990—2018年研究区国土空间分布图Figure 2
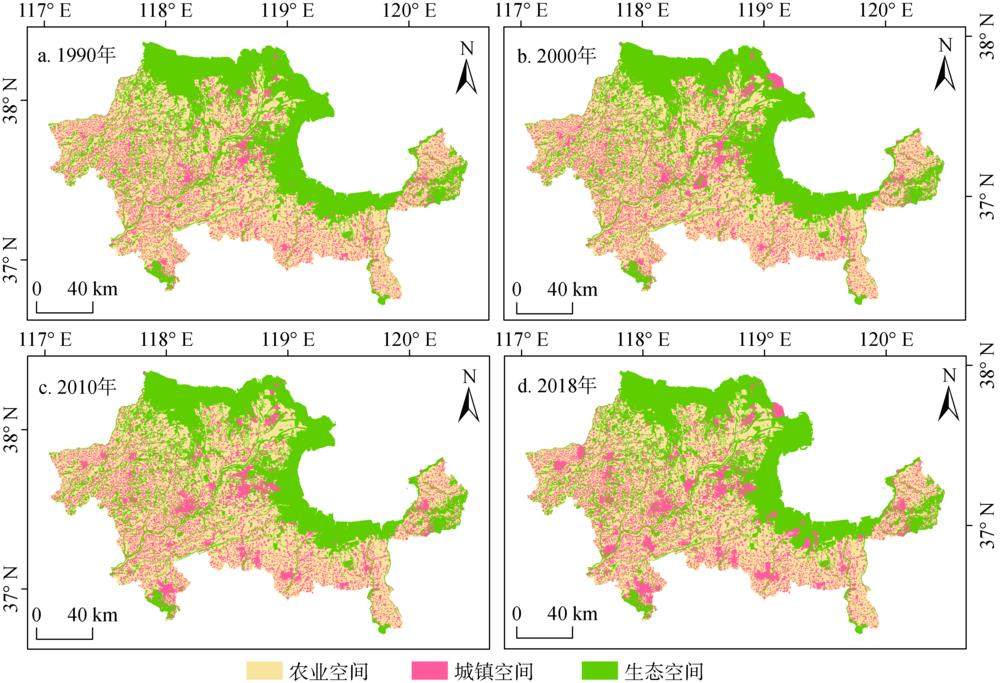
    Fig. 2. 1990—2018年研究区国土空间分布图Figure 2
    1990—2018年研究区国土空间面积占比Figure 3
    Fig. 3. 1990—2018年研究区国土空间面积占比Figure 3
    1990—2018年黄河三角洲高效生态经济区归一化植被指数(NDVI)历年变化Figure 4
    Fig. 4. 1990—2018年黄河三角洲高效生态经济区归一化植被指数(NDVI)历年变化Figure 4
    1990—2018年研究区湿地和岸线资源空间分布图Figure 5
    Fig. 5. 1990—2018年研究区湿地和岸线资源空间分布图Figure 5
    1990—2018年湿地生态系统类型面积变化Figure 6
    Fig. 6. 1990—2018年湿地生态系统类型面积变化Figure 6
    1990—2018年自然及人工岸线长度变化Figure 7
    Fig. 7. 1990—2018年自然及人工岸线长度变化Figure 7
    1950s—2010s花园口、利津断面不同时段年均径流量统计Figure 8
    Fig. 8. 1950s—2010s花园口、利津断面不同时段年均径流量统计Figure 8
    1950s—2010s黄河下游年输沙量变化Figure 9
    Fig. 9. 1950s—2010s黄河下游年输沙量变化Figure 9
    Jun ZHAI, Diandian JIN, Yan CHEN, Xin LIU, Xu YANG, Peng HOU, Yanda XU. Ecological changes, problems and countermeasures in the High Efficiency Eco-economic Zone of the Yellow River Delta[J]. Resources Science, 2020, 42(3): 517
    Download Citation