Author Affiliations
1Xi'an Institute of Optics and Precision Mechanics, Chinese Academy of Sciences, Xi'an 710119, China2University of Chinese Academy of Sciences, Beijing 100049, Chinashow less
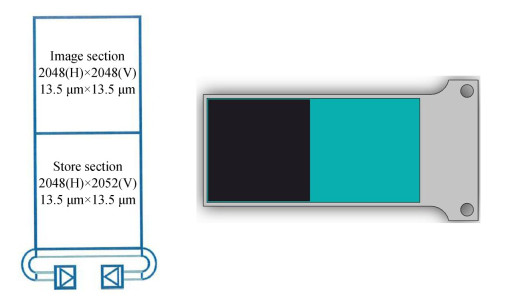
Fig. 1. Telescope detector surface schematic
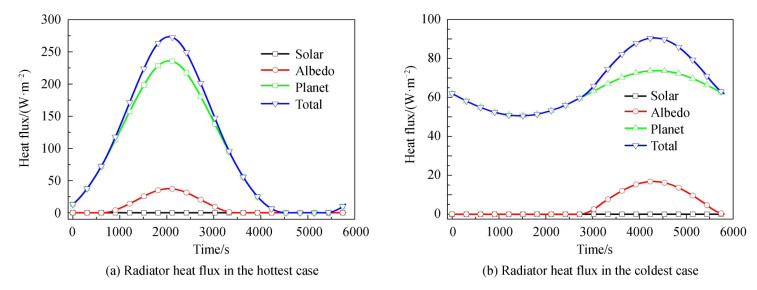
Fig. 2. Space environmental heat flux on radiator in extreme cases
Fig. 3. Schematic of thermal control system for the detector assembly
Fig. 4. Mechanical parameters of the top TEC and bottom TEC
Fig. 5. Package 3D model of detector and TECs
Fig. 6. Heat rejection path and 3D model
Fig. 7. Scheme of TEC drive and control system
Fig. 8. TEC working principles of cooling mode and heating mode
Fig. 9. Sensitivity analysis of the cooling heat loads and thermal resistance on the input power
Fig. 10. System thermal balance test
Fig. 11. Qualification model of CCD assembly
Fig. 12. Qualification model of the telescope
Fig. 13. Detector temperature test results
Fig. 14. TEC hot side temperature test results
Fig. 15. CCD enclosure temperature test results
Fig. 16. Current test results of TECs
Fig. 17. Voltage test results of TECs
Fig. 18. Input power test results of TECs
Case | qsolar min | qsolar max | qalbedo min | qalbedomax | qirmin | qirmax | qtotal min | qtotal max | qaverage | Hottest case | 0 | 0 | 0 | 37.4 | 0 | 236.0 | 0 | 273.4 | 101.7 | Coldest case | 0 | 0 | 0 | 16.8 | 50.5 | 73.7 | 50.5 | 90.5 | 67.1 |
|
Table 1. Space environmental heat flux absorbed by the radiator in the hottest and coldest case
Radiation heat load/mW | Conduction heat load/mW | Active heat load/mW | Total heat loads (no margin) | Total heat loads (including margin) | To image area (εh=0.45) | 80 | 70 | 140 | 853 | 1 000 | To storage area (εh=0.05) | 9 | To silicon area (εh=1.0) | 28 | To SiC area (εh=0.825) | 525 |
|
Table 2. Heat pumped requirements analysis results of TEC
Part No. | N | α/(V•K-1) | ρ/(Ω•cm) | k/(W•cm-1•K-1) | G/cm | QMAX/W | IMAX/A | VMAX /V | ΔTMAX/℃ | CP14, 71, 10, L1, W4.5 | 71 | 1.934×10⁻⁴ | 9.2×10⁻⁴ | 1.61×10⁻² | 0.077 | 18.7 | 3.9 | 8.6 | 68 | CP14, 71, 06, L1, W4.5 | 71 | 1.934×10⁻⁴ | 9.2×10⁻⁴ | 1.61×10⁻² | 0.118 | 28.7 | 6.0 | 8.6 | 67 |
|
Table 3. Thermo-electric parameters of the top and bottom TEC
Parameters | Top TEC | Bottom TEC | Part No. | CP14-71-10L | CP14-71-06L | Heat loads of TEC | 1 W | 4.92 W | Cold side temperature of TEC | -75℃ | -52.5℃ | Hot side sink temperature of TEC | -52.5℃ | -30℃ | Hot side thermal resistance of TEC | 0.05 K/W | 0.05 K/W | Input voltage of TEC | 2.39 V | 3.06 V | Input current of TEC | 1.64 A | 2.87 A | Input power of TEC | 3.92 W | 8.77 W | Hot side heat dissipation of TEC | 4.92 W | 13.69 W |
|
Table 4. Performance analysis of the top and bottom TEC
Results | Heat load/W | Detector temp/℃ | Hot side boundary temperature of top TEC/℃ | Hot side thermal resistance of top TEC/(K·W-1) | Hot side boundary temp of bottom TEC/℃ | Hot side thermal resistance of bottom TEC/(K·W-1) | Temperature difference of top TEC | Temperature difference of bottom TEC | Analysis | 1 | -75 | -52.5 | 0.05 | -30 | 0.05 | 22.5 | 22.5 | Test | 0.7 | -75 | -65 | 0.065 | -34 | 0.065 | 10 | 31 |
|
Table 5. TEC environment parameters comparison between simulation and test
Results | Current of top TEC/A | Voltage of top TEC/V | Input power of top TEC/W | Cop of top TEC | Current of ottom TEC/A | Voltage of bottom TEC/V | Input power of bottom TEC/W | Cop of bottom TEC | Total input power/W | Total heat dissipation/W | Total COP | Analysis | 1.64 | 2.39 | 3.92 | 0.26 | 2.87 | 3.06 | 8.77 | 0.56 | 12.7 | 13.7 | 0.08 | Test | 0.7 | 0.9 | 0.63 | 1.11 | 3.2 | 3.3 | 10.9 | 0.12 | 11.6 | 12.3 | 0.06 |
|
Table 6. TEC working parameters comparison between simulation and test