1Optical Sciences Centre and ARC Training Centre in Surface Engineering for Advanced Materials (SEAM), School of Science, Swinburne University of Technology, Hawthorn 3122, Australia
2Department of Physics, Royal Melbourne Institute of Technology, GPO Box 2476, Melbourne 3001, Australia
3Melbourne Centre for Nanofabrication, Australian National Fabrication Facility, 151 Wellington Road, Clayton, VIC 3168, Australia
4Tokyo Tech World Research Hub Initiative (WRHI), School of Materials and Chemical Technology, Tokyo Institute of Technology, 2-12-1, Ookayama, Meguro-ku, Tokyo 152-8550, Japan
Anand Vijayakumar, Tomas Katkus, Stefan Lundgaard, Denver P. Linklater, Elena P. Ivanova, Soon Hock Ng, Saulius Juodkazis. Fresnel incoherent correlation holography with single camera shot[J]. Opto-Electronic Advances, 2020, 3(8): 200004-1
Copy Citation Text
Fresnel incoherent correlation holography (FINCH) is a self-interference based super-resolution three-dimensional imaging technique. FINCH in inline configuration requires an active phase modulator to record at least three phase-shifted camera shots to reconstruct objects without twin image and bias terms. In this study, FINCH is realized using a randomly multiplexed bifocal binary diffractive Fresnel zone lenses fabricated using electron beam lithography. The object space is calibrated by axially scanning a point object along the optical axis and recording the corresponding point spread holograms (PSHs). An object is mounted within the calibrated object space, and the object hologram was recorded under identical experimental conditions used for recording the PSHs. The image of the object at different depths was reconstructed by a cross-correlation between the object hologram and the PSHs. Application potential including bio-medical optics is discussed.
Fresnel incoherent correlation holography (FINCH) was developed by Joseph Rosen and Gary Brooker in 2007 using the self-interference principle1, 2. Unlike coherent holography, where an object wave interferes with a reference wave which does not carry any information of the object, in incoherent holography, both interfering waves are object waves. Incoherent holography works based on the fundamental principle that any object point is coherent with respect to itself and therefore can coherently interfere. In FINCH, the object wave is split into two using a bifocal diffractive lens displayed on a spatial light modulator (SLM) generating two axially separated images of the object on the optical axis. An image sensor is located in between the two axial images, and the in-line self-interference hologram was recorded1. Holograms corresponding to three phase-shifts (0, 2π/3, and 4π/3) introduced to one of the two diffractive lenses were recorded, and the holograms are projected into the complex space and superposed to produce a complex hologram. The image of the object without the twin image and bias terms is reconstructed by numerically propagating the complex hologram to one of the two image planes. FINCH is considered advantageous compared to existing incoherent imaging techniques as FINCH is motionless and non-scanning3. FINCH went through several upgradations in course of time which converted FINCH into a robust, reliable and super-resolution three-dimensional imaging technique as it is today. In the first design of FINCH1, the numerical reconstruction generated background noise due to the random multiplexing of diffractive lenses. To improve the signal to noise ratio (SNR), a polarization multiplexing scheme was proposed4, in which the super-resolution imaging capability of FINCH was also realized later5. In this technique, the object wave is polarized at 45° with respect to the active axis of the SLM, which results in the modulation of only about half of the intensity of the object wave while the remaining part is not modulated. Consequently, there are two differently modulated object waves. A second polarizer oriented at 45° with respect to the active axis of the SLM creates interference between the two object waves in the image sensor. This method avoided the random multiplexing of lens functions and so improved the signal to noise ratio at the cost of loss of optical power at the polarizers. Then, a wavelength filter was used in FINCH to improve fringe visibility. In later studies, the fringe visibility was improved without the wavelength filter by reducing the path length difference between the two interfering beams using an additional refractive lens6. The working principle and conditions for achieving super-resolution in FINCH are briefly described in Supplementary information Section 1.
The main drawback associated with FINCH was that at least three phase-shifted camera shots were needed resulting in the need of an active device such as an SLM and consequently, could not record faster events. A modified version of FINCH called Fourier incoherent single-channel holography (FISCH) was proposed by Roy Kelner and Joseph Rosen in 2012 which exhibited the same resolution as FINCH but required only a single camera shot7. However, the trade-off was an increase in the number of optical components and complicated beam alignment procedures. Many solutions were developed later to reduce the number of camera shots in FINCH8-12. One solution involved the use of circularly polarized object waves and a micro polarizer array attached to a camera creating four phase-shifted holograms at different pixels of the same sensor. The recorded single camera shot was decomposed into four phase-shifted sparse images that were processed using de-mosaicing and interpolation to fill in the missing pixel information8. In this method, the required four camera shots in time were converted into four sparse camera shots with different polarization states distributed within one camera shot. The technique, even though advanced, suffered from background noise and was unable to reconstruct complicated objects. Another solution9 involved multiplexed gratings, where the image sensor's active pixels were shared among four camera shots with four different phase-shift values. In other words, the required multiple temporal shots were converted into multiple spatially separated low field of view camera shots which can be recorded at once. In Ref.10, a dual focusing lens was implemented with a slit but the twin image could not be removed completely, and the reconstruction was demonstrated only for a simple object such as a point. An off-axis configuration of FINCH was demonstrated in Ref.11 which could not achieve the high resolution of FINCH as perfect beam overlap cannot be achieved in the off-axis configuration. In Ref.12, a geometric phase lens was applied along with a micro polarizer array in the image sensor, and the images were reconstructed with an improved signal to noise ratio in comparison to Ref.8.
All the above earlier attempts to develop a single shot FINCH technique resulted in compromises in the form of an increased number of active and passive optical components, larger overall experimental footprint, and relatively lower performance when compared to the optimal FINCH. With the development of fabrication technologies13, 14 and the shift of research focuses more into reducing the size, weight and overall cost of imaging systems, realizing the optical configurations of Ref.8-12 is often cumbersome for real applications. In this study, we propose a randomly multiplexed bifocal diffractive lens as the only optical element for realizing FINCH. In addition, we propose a modification of the reconstruction mechanism with a manual PSH training technique introduced by Joseph Rosen in the series of developments in coded aperture correlation holography (COACH) 15–18. The result is a single camera shot FINCH technique with manual PSH training and decorrelation.
Methodology
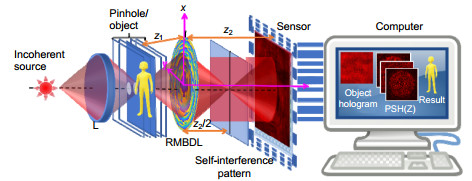
The optical configuration of FINCH with a randomly multiplexed bifocal diffractive lens (RMBDL) is shown in Fig. 1. Light from an incoherent source critically illuminates a multiplane or 3D object and the light diffracted from the object is collected by the RMBDL which splits them into two object waves. One of the object waves is collimated, while the other is focused at a distance, and the self-interference pattern is recorded by an image sensor at a plane where the two object waves are perfectly overlapped. In general, three self-interference patterns are recorded with relative phase-shifts of Φ= 0, 2π/3 and 4π/3 and superposed to generate a complex hologram which is propagated numerically to reconstruct the object1, 4, 5. In the proposed method, a PSH library is first recorded by axially scanning a pinhole along the optical axis within the object space. An object is placed within the calibrated object space and an object hologram is recorded. The image of the object at depths was reconstructed by a cross-correlation between the object hologram and the PSH library as shown in Fig. 216. This reconstruction mechanism has been adapted from COACH. The intermediate computational steps are shown in Fig. 2 for better understanding. The intensity patterns are recorded as images by a monochrome image sensor, frame grabbers and a computer. The images are processed into 8-byte data which is processed in a software with different computational filters such as low pass filter, non-linear filter and median filter, and the images of the object are reconstructed in the computer.
Figure 1.Optical configuration of FINCH with an RMBDL.
Figure 2.PSH library generation, object hologram recording, and computational reconstruction.The blue regions in reconstruction results indicate the areas with the best focus. The point spread holograms are recorded once as images, and the object hologram is recorded. The images in CMYK format were converted into 8-byte data and filtered computationally using low-pass filter, non-linear filter and median filter.
During the reconstruction of the object hologram by the point spread hologram library, the different planes of the object are reconstructed. This process is elaborated as follows: A FINCH hologram of an object consisting of N planes is recorded. When the object hologram is cross-correlated with the point spread hologram recorded at the nth plane, the information of the object in the corresponding plane i.e., nth plane of the object is reconstructed with the best focus (blue regions in the yellow object of Fig. 2), while the information from all the other planes namely –N/2 to n-1 and n+1 to N/2 appear blurred with lesser intensity. Farther a plane from the plane n, higher the blur is and lower the intensity and vice versa19.
The theory of FINCH and COACH is summarized here. Both FINCH and COACH are linear imaging systems with similar input-output mapping i.e., every point in the object space is mapped on to a particular type of intensity distribution in the sensor plane. In FINCH, every object point is mapped to a self-interference pattern between two spherical waves, whereas, in COACH, every object point is mapped to many self-interfering random waves. The above self-interference pattern corresponding to a point is the point spread hologram20. FINCH breaks the Lagrange invariant condition and experiences a constant response to the entire range of spatial frequencies allowed by the numerical aperture while COACH and direct incoherent imaging does not (Supplementary information Section 1). Consequently, FINCH exhibits a higher lateral resolution about 1.5 times better than that of COACH and direct imaging (1.22λz1/D). The axial resolution of direct imaging or COACH is ~8λ(z1/D)2, while FINCH has a relatively lower axial resolution21. In COACH and FINCH, when an object consisting of many points is observed, an intensity pattern which is the sum of shifted and scaled point spread holograms is generated in the sensor plane. In other words, the intensity pattern is made up of the point spread holograms which are the fundamental building blocks in this scenario. For this reason, in both FINCH and COACH, the image of the object can be reconstructed by cross-correlation of the intensity pattern by the point spread hologram. COACH can be considered as the generalized incoherent holographic system as there are many object waves interfering randomly, while FINCH is a special case when there are only two object waves focused at different planes.
Design of RMBDL
The RMBDL is designed using two Fresnel zone lenses designed for two different configurations. The first Fresnel zone lens (FZL1) is designed for infinite conjugate mode with a focal length f =z1, which is the distance between the object plane and the RMBDL and so the incident object wave is collimated by FZL1. The second Fresnel zone lens (FZL2) is designed for finite conjugate mode with u = z1 and v = z2/222. The object wave is focused by FZL2 at z2/2 from the RMBDL. The hologram is recorded approximately at z2 from the RMBDL, where the two beams have roughly the same diameter and are perfectly overlapped. The mathematical analysis is carried out from the object plane to the sensor plane with the origin at the center of the RMBDL. A point located at (0, 0, -z1) emits light with an amplitude of $\sqrt {{I_{\rm{o}}}} $ which reaches the RMBDL with a complex amplitude given by ${C_1}\sqrt {{I_{\rm{o}}}} Q(1/{z_1})$, where C1 is a complex constant and $Q(1/{z_1})$= $\exp [j{\rm{ \mathsf{ π} }}{r^2}/(\lambda {z_1})]$ is the quadratic phase factor in which r is the radial coordinate. In order to produce a wave with a constant phase, the quadratic phase factor must be cancelled by FZL1. Therefore, the complex amplitude of FZL1 must be $\exp [ - j{\rm{ \mathsf{ π} }}{r^2}/(\lambda {z_1})]$ or the phase of the FZL1 must be ${\Phi _{\;{\rm{FZL}}1}} = - {\rm{ \mathsf{ π} }}{r^2}/(\lambda {z_1})$. On the other hand, FZL2 must be designed to convert the complex amplitude$\exp [j{\rm{ \mathsf{ π} }}{r^2}/(\lambda {z_1})]$ into$\exp [ - j2{\rm{ \mathsf{ π} }}{r^2}/(\lambda {z_2})]$ and so the complex amplitude of FZL2 must be$\exp [ - j{\rm{ \mathsf{ π} }}{r^2}(2/{z_2} + 1/{z_1})/\lambda ]$. Assuming z1=z2/2, the phase of FZL2 can be expressed as $f{\Phi _{\;{\rm{FZL}}2}} = - 4{\rm{ \mathsf{ π} }}{r^2}/(\lambda {z_2})$. The aberration correction for the glass substrate22 and the random multiplexing procedure are described in detail in Supplementary information Section 2. The phase of the RMBDL is given as
${\Phi _{\;{\rm{RMBDL}}}} = M\{ - [4{\rm{ \mathsf{ π} }}{r^2}/(\lambda {z_2})] - A\} + (1 - M)\{ - [{\rm{ \mathsf{ π} }}{r^2}/(\lambda {z_1})] - A\} $, where A is the aberration correction factor for the glass substrate, and M is a normalized binary random matrix.
Theoretical analysis
A point object located at $({\bar r_{\rm{o}}}, \; - {z_1})$ emits light with an amplitude of $\sqrt {{I_{\rm{o}}}} $ which reaches the RMBDL with a complex amplitude given by${C_1}\sqrt {{I_{\rm{o}}}} L({\bar r_{\rm{o}}}/{z_1})Q(1/{z_1})$, where $L(\bar o/{z_1}) = exp[{\rm{j}}2{\rm{ \mathsf{ π} }}({o_x}x + {o_y}y)/(\lambda {z_1})]$ is the linear phase factor and ${\bar r_{\rm{o}}} = \left( {{x_{\rm{o}}}, \;{y_{\rm{o}}}} \right)$. It is assumed that the point object has a narrow spectral width and so a single wavelength was used for the following analysis. RMBDL modulates the incoming light and generates two waves in which one is focused at z2/2 from the RMBDL while the other wave is collimated. For simplicity, let us consider only the first-order diffraction patterns and assume that the effect of the glass substrate is cancelled out by the aberration compensation term A. Therefore, the complex amplitude after the RMBDL can be expressed as
where '$ \otimes $' is a 2D convolutional operator. At the image sensor, the interference between the two waves can be written as IPSH= (E1+E2)2. If the point object is located on the optical axis, the linear phase factors can be neglected and the resulting pattern IPSF is an interference pattern between a plane wave and a spherical wave resulting in a circular fringe pattern. The presence of the random multiplexing matrices M and (1–M) introduces some multiplexing noises to the circular fringe pattern. As the illumination is incoherent, a complicated object may be considered as a collection of uncorrelated point objects given as $o({\bar r_{\rm{o}}}) = \sum\nolimits_{i = 1}^M {{a_i}\delta (r - {r_i})} $. The object hologram IOBJ can be given as an addition of the circular fringe patterns corresponding to every object point. Therefore, ${I_{{\rm{OBJ}}}} = {I_{{\rm{PSH}}}} \otimes o({\bar r_{\rm{o}}})$ which can be reduced to ${I_{{\rm{OBJ}}}} = \sum\nolimits_{i = 1}^M {{I_{{\rm{PSH}}}}} \otimes {a_i}\delta (r - {r_i})$. In the previous studies with three camera shots1, 2, 4-6, the image of the object is reconstructed by numerically propagating the complex hologram to the image plane of one of the two object waves. In the proposed method, the correlation relationship between the object hologram and the PSH has been utilized and the image of the object is reconstructed by a cross-correlation between the object hologram and the PSH. The reconstructed image IR can be expressed as17,
where the values of α and β are tuned between -1 to +1 until a case with minimum entropy is obtained. The entropy is expressed as $S(\alpha , \beta ) = - \sum {\sum {f(m, n)} } \log [f(m, n)]$ where $\Phi (m, n) = \;|C(m, n)|/\sum {_M\sum {{f_N}|C(m, n)|} } $, C(m, n) is the correlation distribution, and (m, n) are the indexes of the correlation matrix. A comparison study of different types of filters for reconstructing the object from the hologram is presented in Supplementary information Section 3.
Experiments
Fabrication of RMBDL
An Indium-Tin-Oxide (ITO) coated glass substrate with a thickness of 1.1 mm and the index of refraction approximately 1.5 was ultrasonically cleaned in acetone and Iso-Propyl Alcohol (IPA) for 5 minutes. The substrate was dehydrated by baking it for 5 minutes at 180 ℃ on a hotplate. After cooling to room temperature, tapes were pasted to the sides approximately 4 mm to mask ITO areas during spin coating for electrical contact during electron-beam lithography patterning. The substrate was spin coated with PMMA 950K A7 positive resist at 2000 RPM, ramp of 500 RPM/s for a duration of about a minute. The masking tapes were removed, and the substrate was baked at 180 ℃ on a hot plate for 90 seconds. The substrate was loaded on to a substrate holder and the metal clip was attached to the masked area where the ITO layer is not coated with resist. The design was fabricated on the resist using electron beam direct writing system RAITH 150TWO with 10 kV acceleration voltage, 120 μm aperture, beam current of approximately ~3 nA, write field of 100 μm and a working distance of 10 mm. No stitching error could be observed using optical microscopy, demonstrating that the write field alignment was done very well. The entire pattern was fabricated over a 6 hour period. The optical microscope images of the fabricated device are shown in Fig. 3. It is seen from the fabrication results that there is no stitching error.
Figure 3.Optical microscope images of the fabricated RMBDL.
An experimental set up was built as shown in Fig. 1 with an LED (M617L3, λc = 617 nm, FWHM = 18 nm) which critically illuminates a pinhole with a diameter of 20 μm. The light diffracted from the pinhole is collected by the RMBDL located at a distance of 5 cm from it. The RMBDL splits the beam into two, focusing one at a distance of 5 cm from it while collimating the other beam. The PSH is recorded at 10 cm from the RMBDL by an image sensor (Thorlabs DCU223M, 1024 pixels × 768 pixels, pixel size = 4.65 μm). In the first experiment, the location of the pinhole was shifted from z1–3 cm to z1+3 cm in steps of 5 mm and the corresponding PSHs were recorded. The lateral and axial resolutions of the system are given by 1.22λz1/D and ~8λ(z1/D)2 respectively which are ~7.5 μm and ~0.5 mm respectively. The images of the recorded PSHs are shown in Fig. 4. From the figures, it is seen that the best beam overlap condition was achieved only when the object is located at z1 = 5 cm. The experiment was repeated with a step size of 1 mm and the corresponding PSHs are recorded and cross-correlated with the PSH recorded at z1=5 cm with a phase-only filter. The axial sampling by the pinhole in recording the PSH library depends on the axial resolution of the system. Higher the axial resolution higher is the sampling requirement and vice versa. During every cross correlation between IPSH(z1=5 cm) with IPSH(z1≠5 cm), the reconstructed intensity value at the origin i.e., IR(x=0, y=0) is measured. The plot of IR(x=0, y=0) with the location of the pinhole is shown in Fig. 4(n).
Figure 4.Images of the PSHs recorded for Δz1
= (a) -3 cm, (b) -2.5 cm, (c) -2 cm, (d) -1.5 cm, (e) -1 cm, (f) -0.5 cm, (g) 0.5 cm, (h) 1 cm, (i) 1.5 cm, (j) 2 cm, (k) 2.5 cm, (l) 3 cm and (m) 0 cm. (n) Plot of the variation of IR (x=0, y=0) as a function of Δz1.
The element 1 of Group 4 (16 lp/mm, grating period = 62.5 µm) of the United States Air Force (USAF) resolution target was mounted at z1 = 5 cm and the image of the object was recorded at z2 = 5 cm and the object hologram was recorded at z2 = 10 cm. Since, the image of the object is recorded at u = v = 5 cm configuration, the magnification M = 1 and the features of the captured image match with those of the object. The direct image is shown in Fig. 5(a) and the grating period was found to be 65.1 µm. The image of the hologram is shown in Fig. 5(b). The reconstruction results using the Lucy-Richardson algorithm (250 iterations)23, Weiner filter, Fresnel backpropagation and non-linear correlation (α = 0.2, β = 0.6) are shown in Figs. 5(c)–5(f) respectively. The complete reconstruction results of non-linear filter are given in Supplementary information Section 4. From the results, it is seen that only non-linear filter and Lucy-Richardson algorithm reconstructed the image while the Lucy-Richardson algorithm demonstrated the highest SNR of all cases. However, the Lucy-Richardson method resulted in a lossy reconstruction as the full object information was not obtained. The number '1' was not present in the reconstructed result which was recovered in the case of the non-linear filter. In the following experiments, only the Lucy-Richardson algorithm and non-linear filter were compared.
Figure 5.(a) Direct imaging result of the USAF object recorded at z2=5 cm. (b) FINCH hologram of the USAF object. Reconstruction results using (c) Lucy-Richardson algorithm (250 iterations), (d) Weiner filter, (e) Fresnel back propagation and (f) non-linear filter (α=0.2, β=0.6). (g) Optical microscope image of of the stained biological sample. The area within the rectangular red box was used for the experiments while the rest of the area was masked with a black tape. (h) Magnified image of the sample within the red box. (i) The direct imaging result with the RMBDL recorded at z2=5 cm from the RMBDL. (j) Object hologram. Reconstruction results using (k) non-linear filter (α=0.2, β=0.6) and (l) Lucy-Richardson algorithm (250 iterations). (m) Plots of the normalized, average intensity values of the grating images of direct imaging (blue), non-linear correlation (green) and Lucy-Richardson algorithm (red) with an average visibility values of 0.504, 0.85 and 0.64 respectively. The different colour dotted circles compare identical areas in different reconstructions. It is seen that the direct imaging results could not resolve features as effectively as FINCH.
The experiment was repeated using a biological sample. The sample is a histological thin-section of the dragonfly larvae wing24. The thin section represents the cross-section of the body of the wing showing the morphology of the larval wing at an early stage. The wing was stained using heavy metals then embedded in epoxy resin. Thin-sections were prepared using an ultramicrotome. Thin sections are mounted on a glass slide and stained with Toluidine blue. The image of the sample captured using a regular Nikon microscope is shown in Fig. 5(g). The magnified version of the area of interest is shown in Fig. 5(h). The same image recorded using a direct imaging method with incoherent illumination with red wavelength using the limited NA of RMBDL is shown in Fig. 5(i). The image of the object hologram is shown in Fig. 5(j) and the reconstructed images using the non-linear filter and Lucy-Richardson algorithm are shown in Fig. 5(k) and 5(l) respectively. Comparing Fig. 5(h) with Figs. 5(k) and 5(l) shows that FINCH has a higher lateral resolution than the direct imaging and additional features are visible in FINCH, unlike direct imaging. The horizontal and vertical lines of Figs. 5(a), 5(c) and 5(f) were summed along the direction of the lines pixel by pixel and divided by the number of such single pixel lines and normalized. This normalized average plot shown in Fig. 5(m) is used for comparison between the different methods. The average visibility values of direct imaging (blue), non-linear correlation (green) and Lucy-Richardson algorithm (red) were calculated as 0.504, 0.85 and 0.64 respectively. The visibility of FINCH is better than direct imaging.
The direct imaging results is free of any aberration or artifacts in comparison to the reconstruction results and so the direct imaging result was used for synthesizing an ideal image. The ideal image generated as binary matrix by applying thresholds is shown in Fig. 6(a). The autocorrelation image of Fig. 6(a) is shown in Fig. 6(b). The cross-correlation of direct imaging result, reconstruction results from non-linear filter and Lucy-Richardson algorithm with the synthesized ideal image using a matched filter are shown in Figs. 6(c)–6(e). The plots of the cross-correlation results are compared with the autocorrelation of the ideal image as shown in Fig. 6(f). The narrower the correlation peaks are, the more similar are the two images and vice versa. From the results, it is seen that the Lucy-Richardson algorithm offers a better image fidelity in comparison to non-linear reconstruction. Secondly, the structural similarity index (SSIM) was used to further compare the image fidelity. The former correlation method compares the spatial distribution of the results while SSIM compares three vital parameters namely luminance, contrast and structure. SSIM has consistently outperformed the conventional indicators such as MSE25. The SSIM index is given by
Figure 6.(a) Ideal image synthesized from the direct imaging result. (b) Autocorrelation image of (a). Results of (c) cross-correlation between (a) and Fig. 5 (a), (d) cross-correlation between (a) and Fig. 5 (f), and (e) cross-correlation between (a) and Fig. 5 (c). (f) Plots of the horizontal line data along the origin for (b)–(e). The extracted line data is shown using white dotted line. SSIM index maps calculated by comparing the ideal image with (g) ideal image, (h) direct imaging, (i) FINCH by non-linear reconstruction and (j) FINCH by Lucy-Richardson algorithm.
where I1 and I2 are the two images compared, µ1 and µ2 are the local mean values of I1 and I2, and σ1 and σ2 are the standard deviations. C1 and C2 are constants used to avoid undefined values when the denominator becomes zero due to the sum of squares of local mean or variance becoming zero. The SSIM index maps calculated by comparing the ideal image with itself, direct imaging, FINCH with non-linear reconstruction and FINCH with Lucy-Richardson algorithm are shown in Figs. 6(g)–6(j) respectively and the corresponding SSIM values are 1, 0.1679, 0.1984 and 0.4624. Once again, Lucy-Richardson algorithm outperformed non-linear reconstruction method and also direct imaging matching with the findings of the pattern recognition using correlation. However, unlike the previous results of pattern recognition by correlation, FINCH with non-linear correlation scores better than direct imaging in the cumulative effects of luminance, contrast and structure.
Imaging at the resolution limit
The experiment was repeated at the resolution limit of the imaging system. A USAF object Group 5, Elements 5 (50.8 lp/mm) and 6 (57 lp/mm) were imaged using FINCH. The object and point object holograms are shown in Figs. 7(a) and 7(b) respectively. The objects were imaged using a direct imaging system and the resolution limit was verified. The element 5 of Group 5 was barely resolved while the element 6 was completely unresolved where the three grating lines could not be perceived as three distinct lines as shown in Fig. 7(c). The horizontal and vertical lines were summed along the direction of the lines pixel by pixel and divided by the number of such single pixel lines and normalized. This normalized average plot is used for comparison between the different methods. The normalized average plot of the lines is shown in Fig. 7(d) and the average visibility was found to be 0.06. In the case of non-linear correlation, the three grating lines of Element 5 are well-resolved while in Element 6 the three grating lines can be perceived distinctly as shown in Fig. 7(e), unlike the direct imaging case. The normalized average plot of the grating lines is shown in Fig. 7(f) with a visibility value of 0.7. Lucy-Richardson algorithm was used with 150 iterations and the reconstruction result and the normalized average plot of the grating lines are shown in Figs. 7(g) and 7(h) respectively. The visibility value was 0.7. When the Lucy-Richardson algorithm was used with 200 iterations, the results were improved as shown in Figs. 7(i) and 7(j) and the visibility value were found to be 0.77. As seen earlier, the non-linear correlation was noisy while Lucy-Richardson is lossy. However, in both cases, the resolution enhancement as expected in FINCH is clearly visible. Therefore, this is the first study where the enhanced resolution is demonstrated with a single camera shot. However, further studies are necessary to understand the conditions required to achieve maximum resolution.
Figure 7.Images of the (a) PSH and (b) object hologram of Elements 5 and 6 of Group 5. (c) Direct imaging result of elements 5 and 6 of group 5 and (d) normalized average visibility plot of the gratings. Reconstruction results from (e) non-linear filter and Lucy-Richardson algorithm (g) 150 iterations and (i) 200 iterations. Normalized average plot of the gratings for (f) non-linear filter, Lucy-Richardson algorithm (h) 150 iterations and (j) 200 iterations.
In this section, 3D reconstruction with a two-plane object is studied. A second object, element '14' from the National Bureau of Standards (NBS) mask was mounted at 5 cm from the RMBDL while the USAF object is located at 4.5 cm from the RMBDL. The image of the hologram and the PSHs recorded at z1 = 4.5 cm and z2 = 5 cm are shown in Figs. 8(a)–8(c), respectively. The reconstruction results using the PSH (z1 = 4.5 cm) using Lucy-Richardson algorithm and non-linear filter are shown in Figs. 8(d) and 8(e) respectively. The reconstruction results based on the PSH (z1 = 5 cm) using Lucy-Richardson algorithm and non-linear filter are shown in Figs. 8(f) and 8(g) respectively. Once again Lucy-Richardson method renders a better result than non-linear filter.
Figure 8.(a) Image of the hologram of the two plane object. Point spread holograms recorded at (b) z1 = 4.5 cm and (c) z2
= 5 cm. Reconstruction results: USAF is at z = 4.5 cm and NBS is at z = 5 cm from the RMBDL and reconstructed using the PSH (z1
= 4.5 cm), (d) Lucy-Richardson algorithm and (e) non-linear reconstruction. The reconstruction results of the object hologram using the PSH (z1 = 5 cm), (f) Lucy-Richardson algorithm and (g) non-linear reconstruction.
The FINCH technique has been demonstrated using a single diffractive optical element RMBDL in a compact optical configuration with a single camera shot. In the previous studies, FINCH has been demonstrated using at least three camera shots with phase-shift and therefore required an active device such as a spatial light modulator. Recent developments on achieving a single camera shot imaging with FINCH has shown only a little progress with a sacrifice of either the field of view or reconstruction quality or both8, 10, 11. Besides, none of the above studies demonstrated the super-resolution capability of FINCH. In this study, FINCH has been converted from multiple elements optical system to a single element optical system (RMBDL) with a compact optical configuration. A modified approach based on manual PSH training and cross-correlation principle was adapted for the first time for FINCH. Finally, various reconstruction techniques have been compared to reconstruct objects with the highest SNR. Two techniques namely the Lucy-Richardson algorithm and non-linear filter seem promising for the single camera shot FINCH. Lucy-Richardson algorithm has a higher SNR in comparison to the non-linear filter, however, seems lossy as some of the object information was lost during reconstruction. On the other hand, the non-linear filter reconstructed the object information completely, while has a lower SNR due to the background noise. For both cases, reconstruction results for small objects were found to be better in comparison to larger objects. The current configuration of FINCH produced a higher lateral resolving power in comparison to a direct imaging technique. Further studies are necessary to improve the SNR of reconstruction and demonstrate the maximum super-resolution capability of FINCH. We believe that the proposed optical configuration and reconstruction mechanism will improve the latest versions of FINCH26.
The latest versions of FINCH5, 8-12 require many optical components such as polarizers, lenses and spatial light modulators5; lenses, polarizers and micropolarizer array8, polarizers and lenses9; bifocal lens, slits and lenses10; two mirrors and beam splitter11 and polarizers, geometric phase lens and lenses12 resulting in a bulky optical configuration and experimental footprint. The proposed FINCH configuration is compact and lightweight with only one optical component RMBDL between the object and the sensor plane. A comparison of the latest FINCH versions from the perspective of performances is listed as followed. In Ref.5, at least three camera shots are needed to reconstruct an event without twin image and bias terms. In Ref.8, computer interpolation generates low SNR images. In Ref.9, the field of view is decreased to half. In Ref. 10, the twin image was not completely removed and resulted in low field of view. In Ref.11, the reconstruction has a low SNR. In Ref.12, the reconstruction results were better but still the higher resolution was not demonstrated. The proposed FINCH configuration does not suffer from any of the above disadvantages. The only trade-off in the new configuration is the one-time PSH training procedure. But after the training, the FINCH is capable of imaging with a single camera shot. In summary of all the above methods, the three camera shot requirements were not overcome but either spatial multiplexing or polarization multiplexing or both was employed to obtain the multiple temporal camera shots as spatially separated or polarization discriminated shots arranged within a single shot. The proposed configuration does not require multiple camera shots multiplexed in space or polarization. Most of the discussed studies were carried out with spatially incoherent and temporally coherent illumination. However, in the proposed study, the requirement of temporal coherence has been removed by using an incoherent source with a larger FWHM. We believe that the proposed FINCH system will revolutionize the development of future FINCH-scopes.
Acknowledgements
NATO grant No. SPS-985048 is acknowledged for funding.
Competing interests
The authors declare no competing financial interests.
Author contributions
The idea was proposed by V.A. The design and theoretical analysis was carried out by V.A., which was verified by S.J. The fabrication was carried out by V.A. and T.K. The characterization was done by S.L. and S.H.Ng. The biological samples were prepared by D.L. and E.P.I. The entire research was supervised by S.J.
[23] Perez V, Chang B. -J, Stelzer E H K. Optimal 2D-SIM reconstruction by two filtering steps with Richardson-Lucy deconvolution. Sci Rep6, 37149 (2016).
[25] Wang Z, Bovik A C, Sheikh H R, Simoncelli E P. Image quality assessment: from error visibility to structural similarity. IEEE T Image process, 13, 600-612 (2004).
Anand Vijayakumar, Tomas Katkus, Stefan Lundgaard, Denver P. Linklater, Elena P. Ivanova, Soon Hock Ng, Saulius Juodkazis. Fresnel incoherent correlation holography with single camera shot[J]. Opto-Electronic Advances, 2020, 3(8): 200004-1