
X. M. Zhu, R. Prasad, M. Swantusch, B. Aurand, A. A. Andreev, O. Willi, M. Cerchez, "Relativistic electron acceleration by surface plasma waves excited with high intensity laser pulses," High Power Laser Sci. Eng. 8, 02000e15 (2020)
- High Power Laser Science and Engineering
- Vol. 8, Issue 2, 02000e15 (2020)
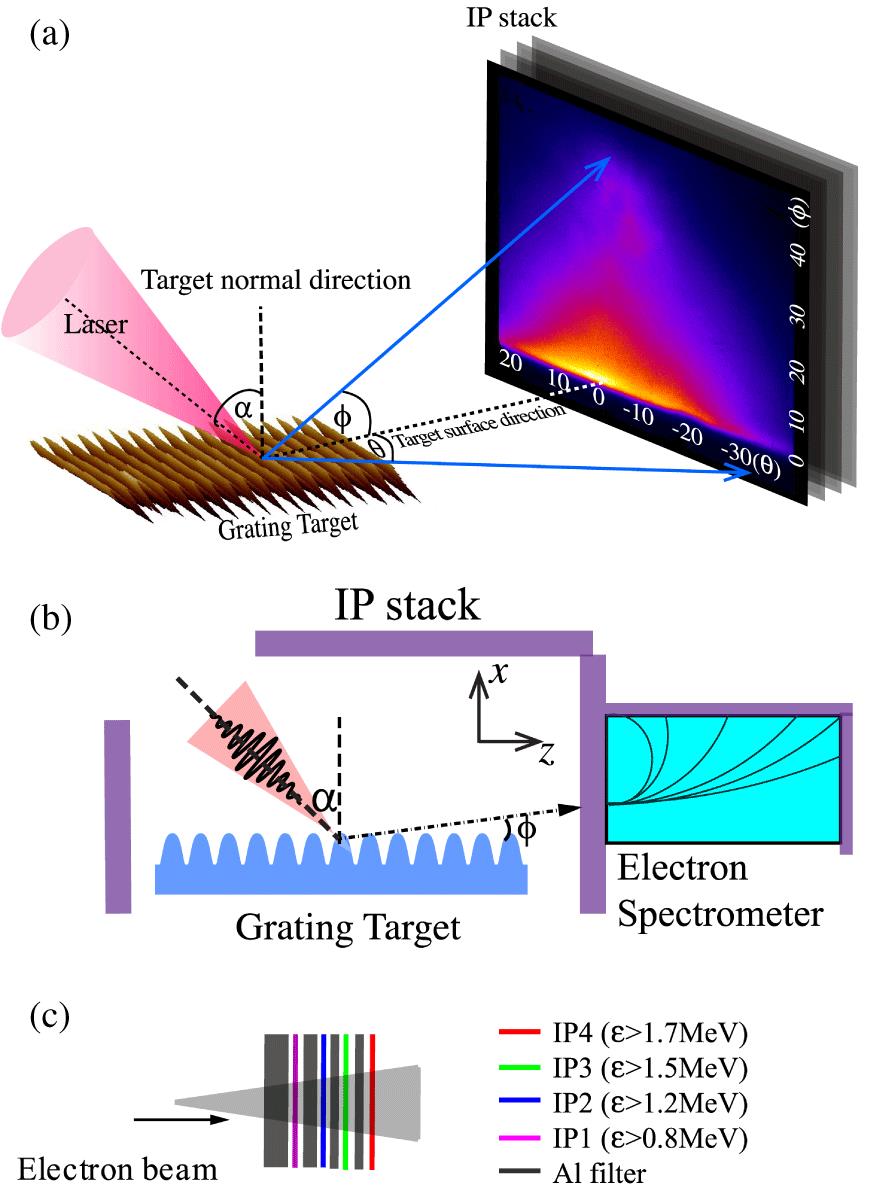
Fig. 1. (a) A schematic of the experimental setup showing the interaction geometry. A laser pulse is focused at an incident angle of  onto a GT with a periodical modulation of
  and of vertical amplitude
  . The spatial distribution of surface electrons is recorded by image plate (IP) stacks.
  and
and  are the azimuthal and polar angles, respectively, used to describe spatially the electrons. (b) The side-on view of experimental setup. Three IP stacks (shown in purple color) are arranged around the interaction point to detect the high energy electrons emitted within an angular range of
  between
  and
and  , and an electron spectrometer is oriented along the target surface direction to measure the energy spectra of the surface fast electrons. (c) The IP stack consists of IPs and aluminum filters of different thicknesses, allowing the electron spatial distribution for different energies to be obtained.
onto a GT with a periodical modulation of and of vertical amplitude . The spatial distribution of surface electrons is recorded by image plate (IP) stacks. and are the azimuthal and polar angles, respectively, used to describe spatially the electrons. (b) The side-on view of experimental setup. Three IP stacks (shown in purple color) are arranged around the interaction point to detect the high energy electrons emitted within an angular range of between and , and an electron spectrometer is oriented along the target surface direction to measure the energy spectra of the surface fast electrons. (c) The IP stack consists of IPs and aluminum filters of different thicknesses, allowing the electron spatial distribution for different energies to be obtained. 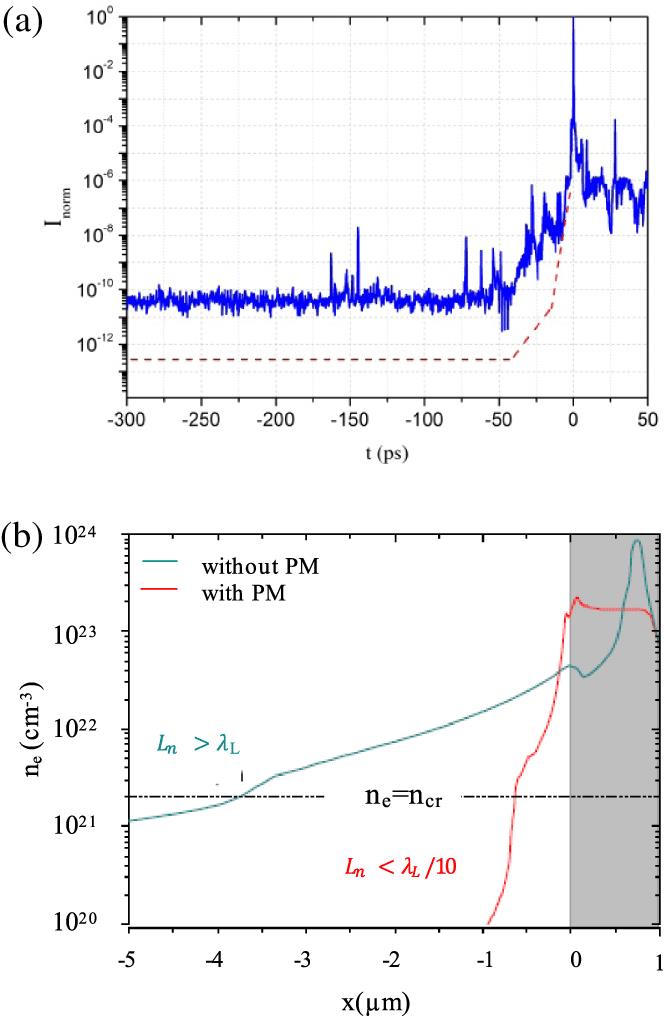
Fig. 2. (a) The temporal profile of the laser pulse after compression (blue line). The red dashed line is the estimated laser contrast improvement due to a plasma mirror (PM) system. (b) Results of the one-dimensional (1D) hydrocode MULTI-fs simulation of the electron density prior to the arrival of the main pulse for two different contrasts (with and without PM) are shown. The gray rectangle on the right-hand side depicts the initial position of the solid target before the interaction.
Fig. 3. Electron spatial distributions recorded for a GT ( ) and an FT at (a), (c)
  and (b), (d)
  , respectively. The IPs raw data correspond to electron energies
  and the color bar expresses the number of electrons. In the diagrams (e) and (f) are presented the angular distributions of fast electrons produced in the incidence plane at full azimuthal angle
  from the GT (green line) and the FT (black line) irradiated by a laser pulse of high contrast at the angle of incidence of
  and
and  with electron energies
  , respectively. In the diagram (g) similar measurements performed for low-contrast conditions at an incidence angle of
  for both targets, GT and FT are shown.
) and an FT at (a), (c) and (b), (d) , respectively. The IPs raw data correspond to electron energies and the color bar expresses the number of electrons. In the diagrams (e) and (f) are presented the angular distributions of fast electrons produced in the incidence plane at full azimuthal angle from the GT (green line) and the FT (black line) irradiated by a laser pulse of high contrast at the angle of incidence of and with electron energies , respectively. In the diagram (g) similar measurements performed for low-contrast conditions at an incidence angle of for both targets, GT and FT are shown. Fig. 4. In the chart (a), the total numbers of electrons ( ) including the SFEs (
 ) with energies larger than
  using GT (
 ) and FT at
  (blue colors) and
  (magenta colors) for different interaction conditions are shown. Abbreviations ‘l’ and ‘h’ stand for low- and high-contrast conditions, respectively, while ‘p’ stands for the case when the grating’s grooves were parallel with the incident laser plane. In all other cases discussed before, the grooves were orientated perpendicularly to the incidence plane. (b) A typical electron energy spectrum of the fast electrons recorded at the high-contrast conditions at
  from the GT tangent direction (
 ) and for
  .
.
) including the SFEs () with energies larger than using GT () and FT at (blue colors) and (magenta colors) for different interaction conditions are shown. Abbreviations ‘l’ and ‘h’ stand for low- and high-contrast conditions, respectively, while ‘p’ stands for the case when the grating’s grooves were parallel with the incident laser plane. In all other cases discussed before, the grooves were orientated perpendicularly to the incidence plane. (b) A typical electron energy spectrum of the fast electrons recorded at the high-contrast conditions at from the GT tangent direction () and for . Fig. 5. Snapshots of 2D PIC simulations showing the magnetic field components  at
at  for the two targets: FT in (a) and GT (
 ) in (b). Laser is incident at
  and its direction is marked by the red arrow. The initial target surface position is indicated by the dotted line and a preplasma of scale length
  was modeled at the front of the target.
at for the two targets: FT in (a) and GT () in (b). Laser is incident at and its direction is marked by the red arrow. The initial target surface position is indicated by the dotted line and a preplasma of scale length was modeled at the front of the target. Fig. 6. The 2D PIC simulation results show the number of SFEs within the angular interval  as a function of the incidence angle for three relevant interaction conditions. Two distinct intensity regimes were considered, described by ‘high
 I ’:  and ‘low
 I ’:  . The effect of the preformed plasma on the number of SFEs in the high intensity regime was studied for different values of the preplasma scale length:
  ,
,  ,
,  and
and  . For a direct comparison to the experimental data, electrons with energies
  were considered. For better visibility, the results in case of
  (low
(low  ) and
) and  (high
(high  ) are shown on a different scale (right-hand side axis).
as a function of the incidence angle for three relevant interaction conditions. Two distinct intensity regimes were considered, described by ‘high and ‘low . The effect of the preformed plasma on the number of SFEs in the high intensity regime was studied for different values of the preplasma scale length: , , and . For a direct comparison to the experimental data, electrons with energies were considered. For better visibility, the results in case of (low ) and (high ) are shown on a different scale (right-hand side axis). Fig. 7. (a) The effect of the preplasma scale length on the number of SFEs for FTs and GTs at  and
and  laser incidence angles. 2D simulation results are shown for SFEs with energies
  accelerated along the target surface within the angular range
  , for three preplasma scale lengths
  and
and  . For all configurations the laser intensity is
  . (b) Simulation results show the angular distributions of the electron energies
  for GT (green line) and FT (black line) for a preplasma scale length of
  . Here the incidence angle was
  and the laser intensity was the same as in (a).
and laser incidence angles. 2D simulation results are shown for SFEs with energies accelerated along the target surface within the angular range , for three preplasma scale lengths and . For all configurations the laser intensity is . (b) Simulation results show the angular distributions of the electron energies for GT (green line) and FT (black line) for a preplasma scale length of . Here the incidence angle was and the laser intensity was the same as in (a). Fig. 8. (a) The approach of the analytical model is schematically shown. (b) The dependence of the longitudinal (along the target surface) normalized electric field component  on the angle of laser incidence (
 ) is presented, at different laser intensities: high
  :
:  ; low
; low  :
:  . For each intensity regime, two values of the plasma parameter
  ,
,  and
and  have been considered with the same plasma inhomogeneity. Data are averaged over the angle interval
  . (c) The analytical calculation of the resonance angle as a function of the laser intensity corresponding to four different plasma parameters:
  (magenta),
  (green),
  (blue) and
  (purple) for a grating of
  .
.
on the angle of laser incidence () is presented, at different laser intensities: high : ; low : . For each intensity regime, two values of the plasma parameter , and have been considered with the same plasma inhomogeneity. Data are averaged over the angle interval . (c) The analytical calculation of the resonance angle as a function of the laser intensity corresponding to four different plasma parameters: (magenta), (green), (blue) and (purple) for a grating of . 

Set citation alerts for the article
Please enter your email address

© Copyright 2018-2021 | Chinese Laser Press. All Rights Reserved 沪ICP备15018463号-20