1Key Laboratory of Quantum Optics, and Center for Cold Atom Physics, Shanghai Institute of Optics and Fine Mechanics (SIOM), Chinese Academy of Sciences, Shanghai 201800, China
2University of Chinese Academy of Sciences, Beijing 100049, China
We report the recent progress of our pulsed optically pumped (POP) vapor cell rubidium clock with dispersive detection. A new compact physics package is made. A rubidium cell with a high precision buffer gases mixing ratio is obtained, and the temperature controlling system is renovated to reduce fractional frequency sensitivity to temperature variation. The resolution of the servo control voltage is also optimized. With these improvements, a clock frequency stability of at 1 s is obtained, and a fractional frequency stability of is achieved at an average time of .
Frequency standards with good performance, low power consumption, and high compactness are used widely in many application fields, like navigation, communication, and fundamental research[1–3]. Atomic clocks based on a vapor cell, such as traditional lamp-pumped atomic clocks[4], continuous-wave double resonance laser-pumped atomic clocks[5], coherent population trapping (CPT) maser[6], and pulsed optically pumped (POP) atomic clocks[7–9], still attract much attention. Among these operation modes, POP has obtained considerable development for its distinctive advantages. The timing sequence of POP includes three stages separated in time, namely the optical pumping phase, the Ramsey interrogation phase, and the detection phase. During the clock interrogation, only the microwave interacts with the atoms. As a result, the light induced frequency shift could be strongly suppressed, and the long-term stability could be improved. Recently, a state of the art POP clock with a measured frequency stability as low as at 1 s and a few units of at , which is better than the performance of a passive hydrogen maser (PHM), has been reported[10].
The first domestic vapor cell rubidium atomic clock was developed at the Shanghai Institute of Optics and Fine Mechanics (SIOM) in the 1970s. After that, we also worked on vapor cell atomic clocks with CPT[11], pulsed coherent storage[12], and the POP mode. Since 2008, we focused on the POP atomic clock and fulfilled the optical detection[13,14]. In 2012, we realized a new dispersive detection method based on the Faraday effect[15]. With this new method, the contrast and signal-to-noise ratio (SNR) of the Ramsey fringe could be improved significantly, and the shot noise limit of the POP clock can be reduced further[16].
In this Letter, we report the latest progress of our POP clock with a fractional frequency stability of at 1 s and a level of at 2000 s. It is improved for about an order of magnitude compared to our reported result in Ref. [17]. The progress is based on some new improvements, such as the manufacture of a new compact physics package, more precise controlling of the mixing ratio in an Rb cell, more stable temperature controlling, and higher resolution output of the servo voltage.
Sign up for Chinese Optics Letters TOC. Get the latest issue of Chinese Optics Letters delivered right to you!Sign up now
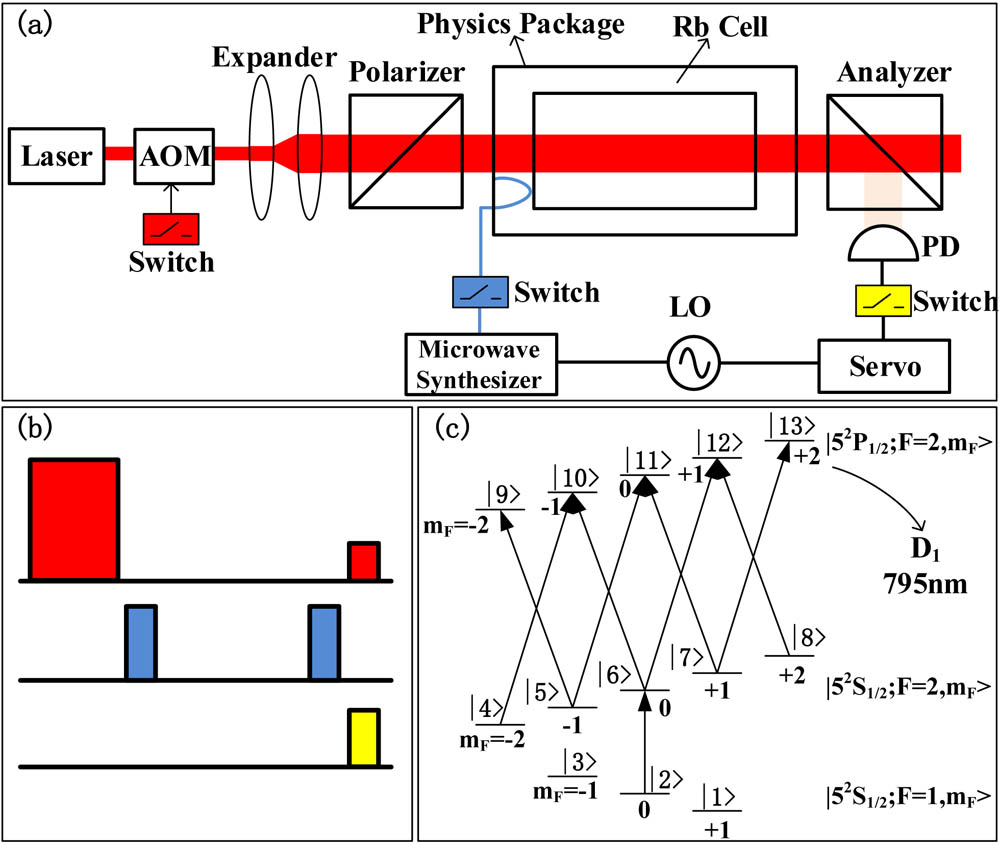
Our system setup is shown in Fig. 1(a), the timing sequence is presented in Fig. 1(b), and the energy level structure involved is given in Fig. 1(c). The frequency of the linearly polarized laser used for the state preparation and detection is locked to the transition of the line through the saturated absorption spectrum. The main part of the laser is sent into the physics package through an acoustic optical modulator (AOM), an expander, and a polarizer. The AOM operating in the double-pass mode acts as an optical switch for the necessary timing sequence of the POP clock. A pair of polarizers (extinction ratio of about ∶) is placed orthogonally at both sides of the physics package for the dispersive detection. The ultimate laser power sent into the physics package for pumping is about 12 mW. The 6.834 GHz microwave signal is generated by a microwave synthesizer (RB-1, SpectraDynamics, Inc.) referred to a 5 MHz local oscillator (LO, BVA-8607, Oscilloquartz Corp.). With the use of a microwave switch (HMC-C019, Hittite Microwave Corp.), we could obtain the two microwave pulses for the Ramsey interrogation. Different from the traditional absorption detection, we use the dispersive detection, which is the total result of absorption and the magneto-optical rotation effect[15,17]. When the microwave pulse area exceeds π/4, the absorption effect becomes more obvious than the rotation effect, which leads to the reduction of the forward scattering signal, and the Ramsey fringe begins to split. To obtain a Ramsey fringe with a conventional profile, we used two π/8 microwave pulses instead of π/2 pulses. With the servo system, the frequency of the LO is locked on the hyperfine transition frequency of .
Figure 1.(a) Schematic setup of the POP clock with dispersive detection. PD, photodetector. (b) Timing sequence for the POP clock. Top red, optical pulses for state preparation and detection; middle blue, two microwave pulses for Ramsey interrogation; bottom yellow, trigger pulse for signal acquisition. These pulses correspond to the switches in different colors in (a). (c) Detailed energy level structure of involved in the POP clock. The transition between and is chosen as the clock transition with a frequency of about 6.8346 GHz.
Figure 2(a) shows the detailed three-dimensional (3D) profile map of the compact physics package, which is one of the most important improvements we made. The core of the physics package is a quartz cell containing and a mixture of Ar and (mixing ratio of about ∶) with a total pressure of 25 Torr. The cell is fixed in the center of a cylindrical mode microwave cavity. The loaded quality factor of the cavity is about 100, so that the cavity pulling can be reduced significantly. The cavity is housed in an Al cylinder, which supports a solenoid that defines the quantization axis and lifts the degeneracy of the Zeeman sublevels for the clock transition. The C-field used here is about 13 mG with a Zeeman shift of about 9 kHz. The magnetic field, the laser propagation direction, and the cavity axis are set to be parallel. Three magnetic shields made from permalloy with a total shield factor of about 1000 are used to isolate the atoms from the outside magnetic field. Two heating films warm the microwave cavity to a temperature of about 58.7°C.
Figure 2.(a) Schematic of the new physics package. The cell filled with and buffer gases has a size of mm fixed in a microwave cavity resonant at 6.8 GHz. The size of the physics package is about with a volume of about 2.2 L. (b) Microwave–light double resonance signal. The three peaks correspond to the transitions () between hyperfine levels of . (c) Ramsey oscillating signal. We fixed the microwave frequency on the clock transition frequency and measured the Ramsey signal by changing the microwave power. (d) Ramsey fringe measured with the new physics package. The fringe has a contrast of about 97%, an SNR of about 2400, and a line width of about 140 Hz.
To characterize the distribution mode in the microwave cavity and the coupling microwave power of the cavity, we measured the microwave–light double resonance signal and the Ramsey oscillating curve, presented in Figs. 2(b) and 2(c), respectively. The two ground-state hyperfine levels of split into eight Zeeman sublevels under the magnetic field, which correspond to seven transition peaks. However, in Fig. 2(b), there are only three transition peaks, corresponding to the transitions (), which implies that the cavity mode of the new microwave cavity has a highly uniform magnetic field distribution oriented almost exclusively parallel to the quantization axis over the entire cell volume. We then fixed the microwave frequency on the clock transition frequency and measured the Ramsey signal by changing the microwave power, shown in Fig. 2(c). From Fig. 2(c), we could infer that to achieve the π/8 microwave area, the needed microwave power of the new cavity is only about .
With this new physics package, we also optimized the associated parameters involved, like each phase time of the timing sequence, the power of the pumping laser and detecting laser, etc. The Ramsey interrogation time is set as 3.5 ms. The ultimate Ramsey fringe measured with the new physics package is shown in Fig. 2(d) with an ultrahigh contrast of about 97% and an SNR of about 2400. The linewidth is about 140 Hz, which is consistent with the theoretical prediction ()[18].
The medium- to long-term frequency stability of the atomic clocks based on a vapor cell relies mainly on the temperature variation. This depends on the mixing ratio of the buffer gases and the working temperature. The buffer gases used here can prolong the coherent time of and narrow the Doppler linewidth from 7 kHz to about 100 Hz at the frequency of the clock transition, known as the Dicke effect[19]. But the buffer gases can also lead to a shift of the clock transition frequency given by[20]where is the buffer gas pressure; is the pressure coefficient, corresponding to the pressure shift; and are the linear and quadratic temperature coefficients, respectively, where is far greater than ; is the difference between the working temperature and the measured temperature of these two coefficients. The last two terms correspond to the temperature shift. They play important roles in medium- to long-term frequency stability. Here, we use and Ar, since can quench the excited state in a non-radiative way and Ar acts as a temperature-compensated gas. From Eq. (1), we could find that the frequency shift versus the cell temperature is a parabola. It means that if we set the working temperature at the apex of the parabola, it is possible to reduce the temperature sensibility. We then measure the fractional frequency shift between the 5 MHz output of the POP clock and the hydrogen maser at different working temperatures. Each data is measured at an average time of 100 s. Fig. 3(a) shows the relation curve between the fractional frequency shift and the temperature. The black squares are experimental data, and the continuous red line is a fit with the parabola of these data. We could easily find that the best working temperature is about 58.7°C, where the fractional frequency is insensitive to the working temperature variation.
Figure 3.(a) Fractional frequency under different temperatures. Black square, experimental data; red curve, fit line. (b) Temperature stability in terms of the Allan deviation and the Hadamard deviation under different average times.
In order to further reduce the influence from the temperature variation, we developed a new temperature controlling system with high temperature stability. The frequency stability of the POP clock in the medium- to long-term is mainly dependent on the instability of the cell temperature. It has an influence on not only the buffer gas shift as previously mentioned but also on many other shifts, like the cavity pulling shift. A much more stable temperature is essential to improving the performance of the clock. We then fixed a negative temperature coefficient thermistor (NTC) at the lid of the microwave cavity and measured the real-time temperature data. The ultimate calculated temperature stability of the microwave cavity is shown in Fig. 3(b). The red line is calculated in an Allan deviation, and the black line is done in Hadamard deviation. A stability of about 120 μK at 2000 s is obtained at 58.7°C. When the averaging time is larger than 2000 s, the temperature instability becomes very large and severely deteriorates the frequency stability of our POP clock.
Besides the Ramsey fringe with a high SNR and narrow linewidth, the servo control system with high resolution is also an important factor that influences the performance of our POP clock. When the clock operates in close-loop, the variation range of the control voltage outputting to the LO is only about tens of a microvolt. In the previous experiment, we used a 16 bit analog output channel of NI-6251 (National Instruments corp.) with a resolution of about 150 μV to output the ultimate control voltage to tune the frequency of the LO. It means that the servo control voltage is submerged in the board noise. Then, we replaced it with a 20 bit digital-to-analog converter (DAC) circuit (AD 5791, ADI Corp.), since it has a lower temperature drift (less than 1 ppm/°C) and a higher resolution (about 9.5 μV)[21]. Therefore, the output control voltage is much closer to the real value. The 20 bit DAC is controlled by a single chip microcomputer (SCM).
With the improvements mentioned above, we lock the LO on the central fringe of the Ramsey pattern shown in Fig. 2(d). In this experiment, the frequency reference is derived from the hydrogen maser (VCH-1003a, a day) with frequency of 100 MHz. The 100 MHz signal of the hydrogen maser is amplitude modulated into a laser and sent into our lab through a 200 m optical fiber. After demodulation, it is frequency-divided into a 5 MHz reference signal with a frequency stability of about . The clock frequency stability measured is presented in Fig. 4. The black line is the Allan deviation with a drift of about removed. The red line is the results shown in a Hadamard deviation. At 1 s, the frequency stability is about , and reaches at an average time of 2000 s. Since the value of the reference frequency standard of at 1 s is very close to the clock stability of at 1 s that is calculated based on the SNR and the linewidth of Fig. 2(d), the comparison result calculated is at 1 s. As a result, the short-term frequency stability is obviously affected by the reference frequency standard. The system is placed in an open environment, and many environment perturbations may deteriorate the medium- to long-term performance of our clock. A detailed analysis of the instability sources and their impact on the clock stability is in progress.
Figure 4.Frequency stability of the POP clock compared with the H maser. A drift of about is removed from the data. A clock frequency stability of at 1 s is obtained, and the medium-term fractional frequency stability of is achieved at an averaging time of .
In conclusion, we manufacture a new compact physics package. The microwave–light double resonance signal and Ramsey oscillating curve are presented to characterize the cavity mode and the coupling power of the new microwave cavity. We also obtain an Rb cell with a temperature inflection point at 58.7°C. With a high stability temperature controlling system, we minimize the influence of the temperature variation on the frequency stability. To make the output voltage of the servo loop closer to the real value, we apply a new 20 bit DAC. After the improvements, the frequency stability of our POP clock is at 1 s, and reaches at an average time of 2000 s. Our clock should be the second POP clock in the world that the frequency stability has reached a few units of [10].
References
[1] F. Riehle. Frequency Standards: Basics and Applications(2006).