• Acta Photonica Sinica
  • Vol. 50, Issue 7, 238 (2021)
Nan ZHAO, Yang LIU*, Ningyang ZHAO, Longge MA, Meicong LI, Jingjing JIAO, and Chenfei DING
Author Affiliations
  • Schoolof Electrical and Electronic Engineering, Shijiazhuang Tiedao University, Shijiazhuang050043, China
  • show less
    DOI: 10.3788/gzxb20215007.0730001 Cite this Article
    Nan ZHAO, Yang LIU, Ningyang ZHAO, Longge MA, Meicong LI, Jingjing JIAO, Chenfei DING. Establishment and Optimization of Photoacoustic Cell Model in Photoacoustic Spectrum Detection System[J]. Acta Photonica Sinica, 2021, 50(7): 238 Copy Citation Text show less
    Structure diagram of detection system
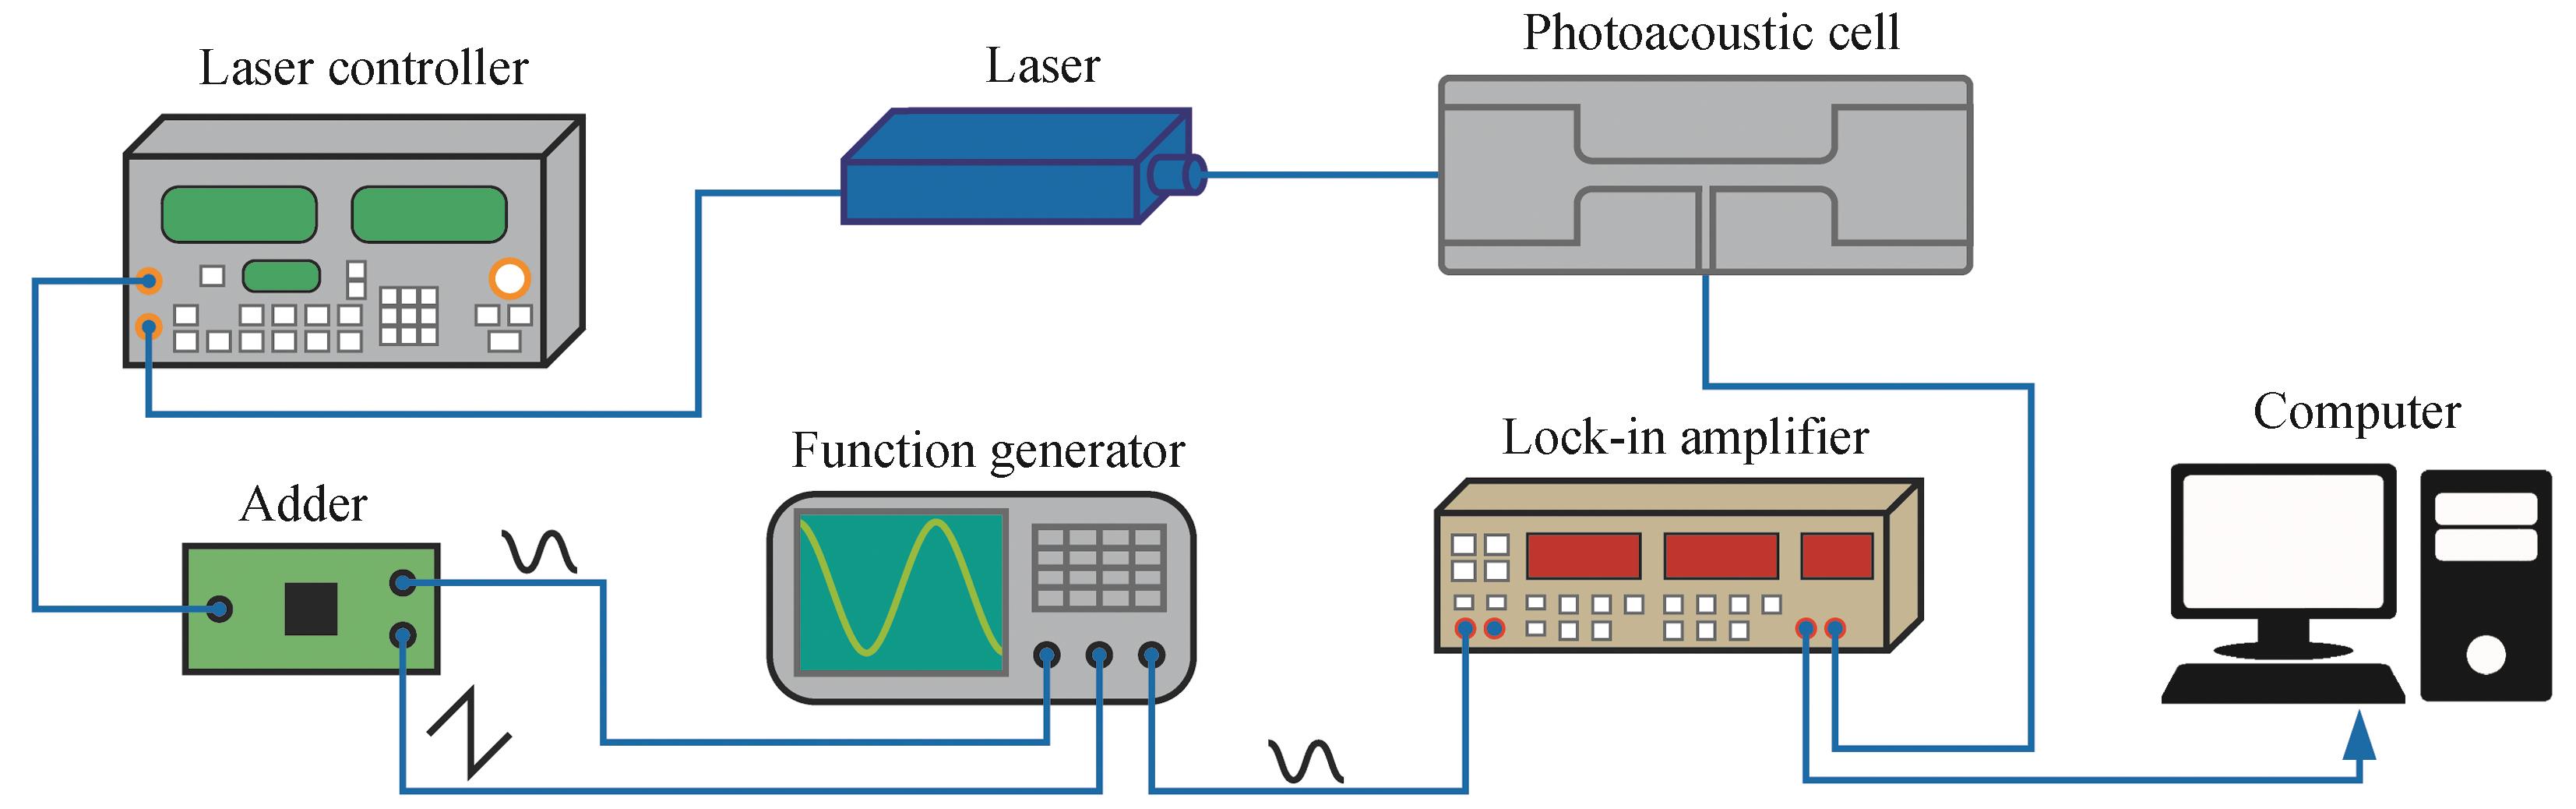
    Fig. 1. Structure diagram of detection system
    Schematic diagram of photoacoustic cell structure
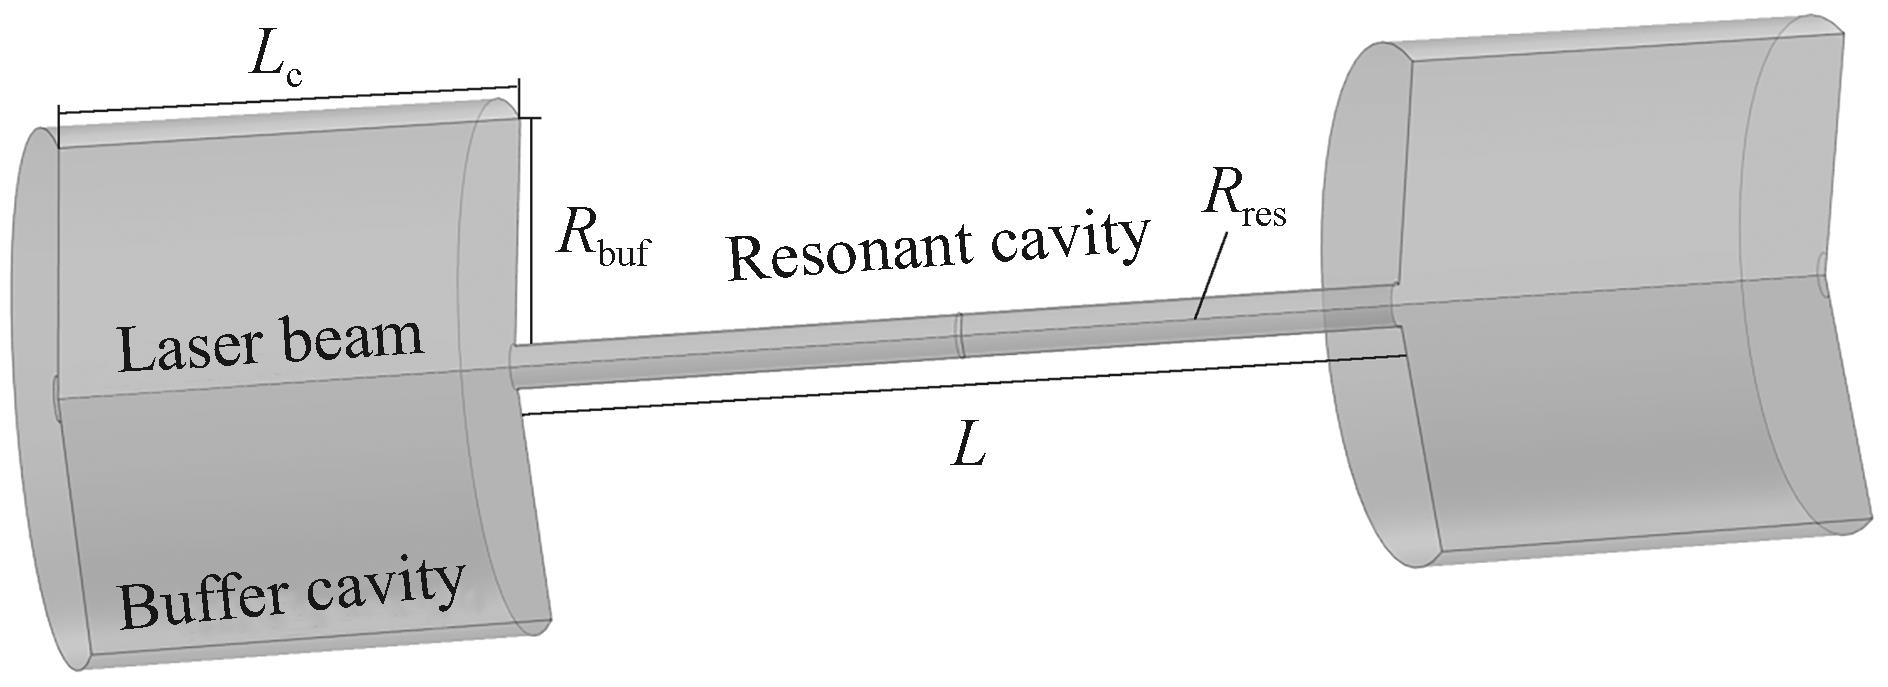
    Fig. 2. Schematic diagram of photoacoustic cell structure
    Grid model of photoacoustic cell
    Fig. 3. Grid model of photoacoustic cell
    Rough scanning simulation results of three variables
    Fig. 4. Rough scanning simulation results of three variables
    Detailed scanning simulation results of three variables
    Fig. 5. Detailed scanning simulation results of three variables
    Acoustic pressure with resonant cavity radius of 2 mm, 3 mm and 4 mm
    Fig. 6. Acoustic pressure with resonant cavity radius of 2 mm, 3 mm and 4 mm
    The influence caused by the change of the buffer cavity radius
    Fig. 7. The influence caused by the change of the buffer cavity radius
    Rough scanning of global frequency
    Fig. 8. Rough scanning of global frequency
    Partial frequency refinement scan
    Fig. 9. Partial frequency refinement scan
    The distribution of acoustic pressure in the photoacoustic cell at 1 387.9 Hz
    Fig. 10. The distribution of acoustic pressure in the photoacoustic cell at 1 387.9 Hz
    Photoacoustic cell with rounded corners
    Fig. 11. Photoacoustic cell with rounded corners
    Acoustic pressure comparison of right-angle and round-angle photoacoustic cell
    Fig. 12. Acoustic pressure comparison of right-angle and round-angle photoacoustic cell
    Acoustic pressure distribution of a photoacoustic cell with rounded corners
    Fig. 13. Acoustic pressure distribution of a photoacoustic cell with rounded corners
    Frequency response diagram
    Fig. 14. Frequency response diagram
    Noise distribution diagram
    Fig. 15. Noise distribution diagram
    Substanceρ0/(kgm-3)γM/(kgmol-1)η/(paS-1)K/(Wm-1K-1)CP/(Jmol-1K-1)
    N21.251.4010.0281.75×10-526×10-329.1
    Table 1. Physical constants of nitrogen
    f/HzQP/PaCcell/(Pa·cm·W-1
    1 387.932.3410.099 73 552.3
    Table 2. Performance data of right-angle photoacoustic cell
    R/mf/HzQP/Pa
    0.0011 390.735.5640.126 86
    0.0021 401.235.6990.116 06
    0.0031 413.935.8590.111 24
    0.0041 427.536.0310.106 74
    0.0051 442.636.2210.104 89
    0.0061 458.736.4320.102 45
    0.0071 475.436.6310.100 39
    0.0081 493.636.8560.099 33
    0.0091 512.737.0910.0980 5
    0.011 532.037.3270.098 47
    Table 3. Performance data of round corner photoacoustic cell
    Analytic valueSimulation valueExperimential value
    f/Hz1 3951 413.91 394
    Q35.3635.8627.33
    Ccell/(Pa·cm·W-13 787.33 635.12 574
    Table 4. Comparison of experiment and calculated results
    Nan ZHAO, Yang LIU, Ningyang ZHAO, Longge MA, Meicong LI, Jingjing JIAO, Chenfei DING. Establishment and Optimization of Photoacoustic Cell Model in Photoacoustic Spectrum Detection System[J]. Acta Photonica Sinica, 2021, 50(7): 238
    Download Citation