• Photonics Research
  • Vol. 8, Issue 6, 844 (2020)
Riccardo Pennetta1、*, Shangran Xie1, Richard Zeltner1, Jonas Hammer1、2, and Philip St. J. Russell1、2
Author Affiliations
  • 1Max Planck Institute for the Science of Light, Staudtstraße. 2, 91058 Erlangen, Germany
  • 2Department of Physics, Friedrich-Alexander-Universität, Staudtstraße. 2, 91058 Erlangen, Germany
  • show less
    DOI: 10.1364/PRJ.380151 Cite this Article Set citation alerts
    Riccardo Pennetta, Shangran Xie, Richard Zeltner, Jonas Hammer, Philip St. J. Russell. Optomechanical cooling and self-stabilization of a waveguide coupled to a whispering-gallery-mode resonator[J]. Photonics Research, 2020, 8(6): 844 Copy Citation Text show less
    Nanospike coupled to a WGM bottle resonator. (a) Sketch of the experimental setup. NS, nanospike; BR, bottle resonator; QPD, quadrant photodiode; PD, photodiode. (b) Optical micrograph of the nanospike coupled to a WGM resonator from the side. (c) Micrograph of a bottle resonator when the laser light is locked into resonance, light being launched from the right. The weak signal radiated by the bottle resonator on resonance could be used to image the near-field of the optical mode using a microscope objective and a sensitive NIR camera. (d) Zoom-in of one of the measured optical mode profiles compared with the result of finite element simulations.
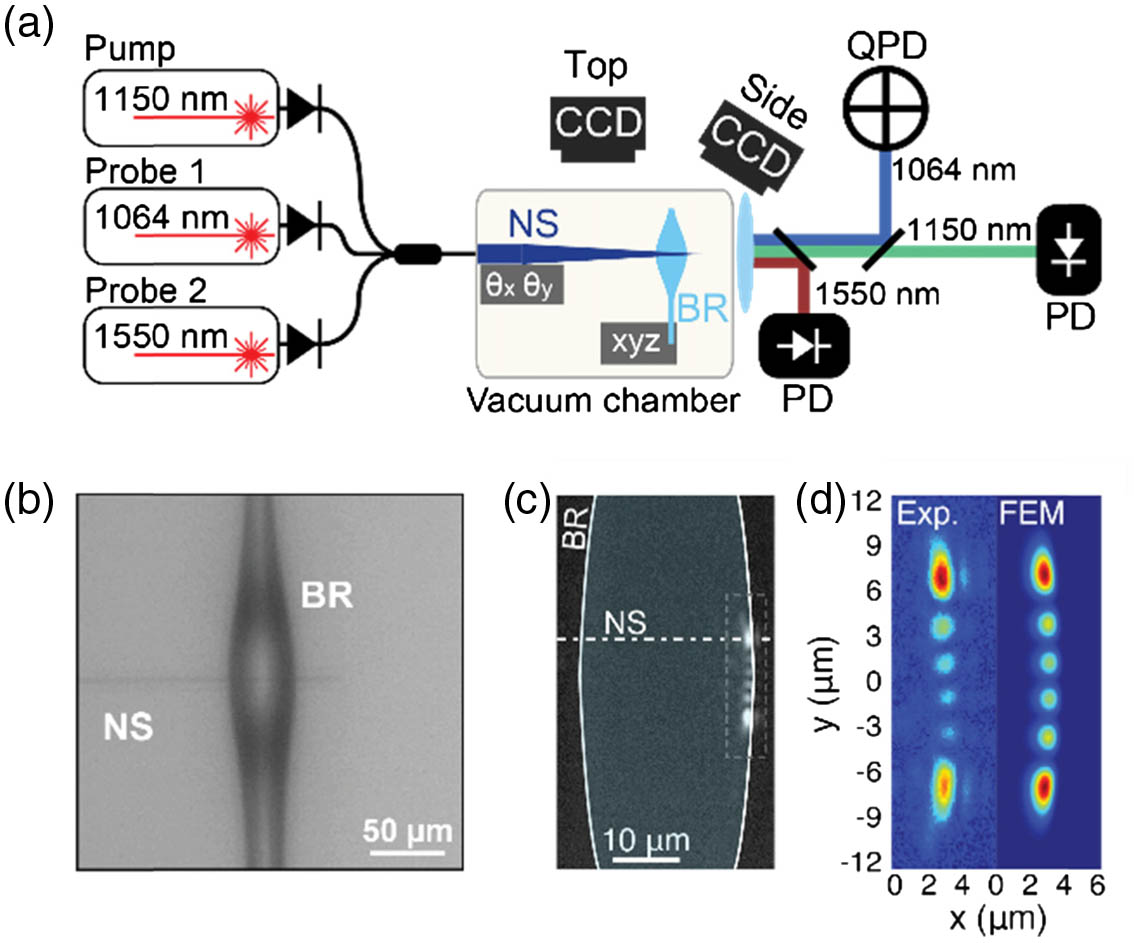
    Fig. 1. Nanospike coupled to a WGM bottle resonator. (a) Sketch of the experimental setup. NS, nanospike; BR, bottle resonator; QPD, quadrant photodiode; PD, photodiode. (b) Optical micrograph of the nanospike coupled to a WGM resonator from the side. (c) Micrograph of a bottle resonator when the laser light is locked into resonance, light being launched from the right. The weak signal radiated by the bottle resonator on resonance could be used to image the near-field of the optical mode using a microscope objective and a sensitive NIR camera. (d) Zoom-in of one of the measured optical mode profiles compared with the result of finite element simulations.
    Optomechanical cooling of nanospike motion. (a) Measured mechanical power spectrum in the vicinity of the fundamental (flexural) nanospike mode for five different pump powers. Inset: measured power spectrum for vibrations parallel to the surface (see text) for 0 and 250 μW pump power. The solid lines are Lorentzian fits. (b) Mechanical linewidth (left axis) and inferred effective temperature Teff (right axis) as a function of pump power. The dashed lines are guides for the eye. Inset: same measurement as in (b) but for vibrations parallel to the surface. (c) Measured mechanical power spectra in the vicinity of the first high order (flexural) nanospike mode for increasing values of pump power. The solid lines are Lorentzian fits. Inset: linewidth (left axis) and effective temperature Teff (right axis) of the same mechanical mode as a function of the pump power.
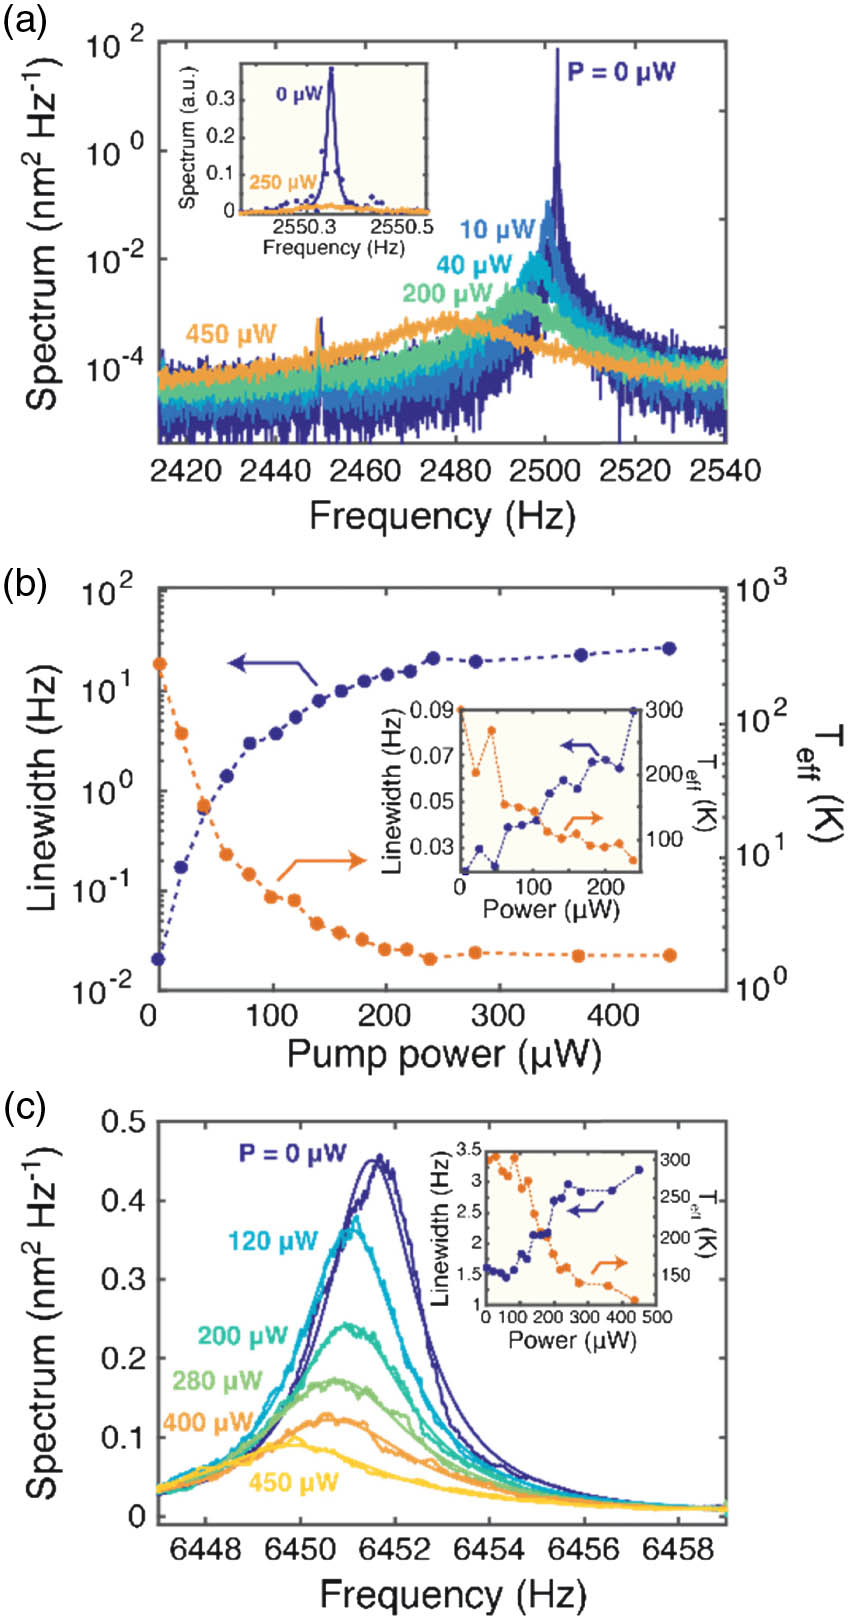
    Fig. 2. Optomechanical cooling of nanospike motion. (a) Measured mechanical power spectrum in the vicinity of the fundamental (flexural) nanospike mode for five different pump powers. Inset: measured power spectrum for vibrations parallel to the surface (see text) for 0 and 250 μW pump power. The solid lines are Lorentzian fits. (b) Mechanical linewidth (left axis) and inferred effective temperature Teff (right axis) as a function of pump power. The dashed lines are guides for the eye. Inset: same measurement as in (b) but for vibrations parallel to the surface. (c) Measured mechanical power spectra in the vicinity of the first high order (flexural) nanospike mode for increasing values of pump power. The solid lines are Lorentzian fits. Inset: linewidth (left axis) and effective temperature Teff (right axis) of the same mechanical mode as a function of the pump power.
    (a) Temporal motion of the nanospike for different launching pump powers (sampling rate 20 kHz). (b) Histogram plots of the nanospike displacements. (c) Mean-squared displacements of the nanospike as a function of pump power. (d) and (e) 50 consecutive measurements of a cavity resonance observed with the second probe laser (1550 nm) when Teff equals (d) 300 K and (e) 6.7 K. (f) Minimum transmission recorded in (d) and (e) as a function of the measurement number; the blue dots correspond to Teff=300 K and the orange dots to Teff=6.7 K. The fluctuations in the experimental data are artifacts of the short total acquisition time (1 s), which was much less than the lifetime of the fundamental mechanical mode (∼30 s). (g) Nanospike deflection collected over 1.5 ms for Teff=300 K (blue line) and Teff=6.7 K (orange line).
    Fig. 3. (a) Temporal motion of the nanospike for different launching pump powers (sampling rate 20 kHz). (b) Histogram plots of the nanospike displacements. (c) Mean-squared displacements of the nanospike as a function of pump power. (d) and (e) 50 consecutive measurements of a cavity resonance observed with the second probe laser (1550 nm) when Teff equals (d) 300 K and (e) 6.7 K. (f) Minimum transmission recorded in (d) and (e) as a function of the measurement number; the blue dots correspond to Teff=300  K and the orange dots to Teff=6.7  K. The fluctuations in the experimental data are artifacts of the short total acquisition time (1 s), which was much less than the lifetime of the fundamental mechanical mode (30  s). (g) Nanospike deflection collected over 1.5 ms for Teff=300  K (blue line) and Teff=6.7  K (orange line).
    (a) Measured frequency shift of the fundamental flexural mode of the nanospike coupled to a WGM resonator with a diameter of 350 μm, plotted against laser detuning for a launched power of 70 μW (blue dots). The solid line is a fit to the model for generalized optomechanical coupling. Inset: nanospike deflection as a function of time when the pump power was raised just above the threshold for self-oscillation for a laser detuning of 1.6 MHz. (b) Measured mechanical frequency as a function of laser detuning for mechanical oscillation of the nanospike parallel (Ω∥) and orthogonal (Ω⊥) to the WGM surface (see Appendix E for detailed information).
    Fig. 4. (a) Measured frequency shift of the fundamental flexural mode of the nanospike coupled to a WGM resonator with a diameter of 350 μm, plotted against laser detuning for a launched power of 70 μW (blue dots). The solid line is a fit to the model for generalized optomechanical coupling. Inset: nanospike deflection as a function of time when the pump power was raised just above the threshold for self-oscillation for a laser detuning of 1.6 MHz. (b) Measured mechanical frequency as a function of laser detuning for mechanical oscillation of the nanospike parallel (Ω) and orthogonal (Ω) to the WGM surface (see Appendix E for detailed information).
    (a) Measured frequency shift (left axis) and linewidth (right axis) for the excited WGM plotted against nanospike position. The solid lines are fits to the data using exponential functions. (b) Coupling parameters θ1 (dispersive coupling, right axis) and γ1 (dissipative coupling, right axis) plotted as a function of nanospike position.
    Fig. 5. (a) Measured frequency shift (left axis) and linewidth (right axis) for the excited WGM plotted against nanospike position. The solid lines are fits to the data using exponential functions. (b) Coupling parameters θ1 (dispersive coupling, right axis) and γ1 (dissipative coupling, right axis) plotted as a function of nanospike position.
    (a) Dissipative coupling parameter γ1 measured at critical coupling. (b) Corresponding ratio between the dissipative and dispersive coupling parameters (i.e., γ1/θ1). (c) Intrinsic Q-factor for bottle resonators with different diameters. Each cross corresponds to a different optical mode.
    Fig. 6. (a) Dissipative coupling parameter γ1 measured at critical coupling. (b) Corresponding ratio between the dissipative and dispersive coupling parameters (i.e., γ1/θ1). (c) Intrinsic Q-factor for bottle resonators with different diameters. Each cross corresponds to a different optical mode.
    Measured resonant frequency shift over time for bottle-resonators with diameters (a) 350 μm and (b) 40 μm. Fitting the data to exponential functions (solid lines) yields thermal time constants (a) τ350 μm=8.3 s and (b) τ40 μm=0.28 s.
    Fig. 7. Measured resonant frequency shift over time for bottle-resonators with diameters (a) 350 μm and (b) 40 μm. Fitting the data to exponential functions (solid lines) yields thermal time constants (a) τ350μm=8.3  s and (b) τ40μm=0.28  s.
    Riccardo Pennetta, Shangran Xie, Richard Zeltner, Jonas Hammer, Philip St. J. Russell. Optomechanical cooling and self-stabilization of a waveguide coupled to a whispering-gallery-mode resonator[J]. Photonics Research, 2020, 8(6): 844
    Download Citation