• Journal of Geographical Sciences
  • Vol. 30, Issue 4, 535 (2020)
Xiang LUO1, Xinhe AO1, Zuo ZHANG1, Qing WAN2、*, and Xingjian LIU3
Author Affiliations
  • 1College of Public Administration, Central China Normal University, Wuhan 430079, China
  • 2School of Management, Wuhan Institute of Technology, Wuhan 430205, China
  • 3Department of Urban Planning and Design, University of Hong Kong, Hong Kong 999077, China
  • show less
    DOI: 10.1007/s11442-020-1741-8 Cite this Article
    Xiang LUO, Xinhe AO, Zuo ZHANG, Qing WAN, Xingjian LIU. Spatiotemporal variations of cultivated land use efficiency in the Yangtze River Economic Belt based on carbon emission constraints[J]. Journal of Geographical Sciences, 2020, 30(4): 535 Copy Citation Text show less
    Geographical location of the Yangtze River Economic Belt (YREB)
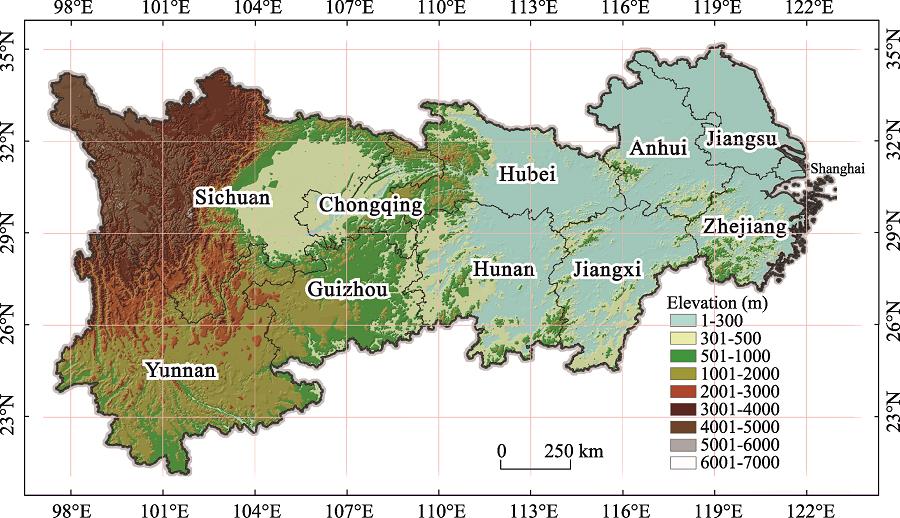
    Fig. 1. Geographical location of the Yangtze River Economic Belt (YREB)
    Spatiotemporal variations of cultivated CEs in the Yangtze River Economic Belt
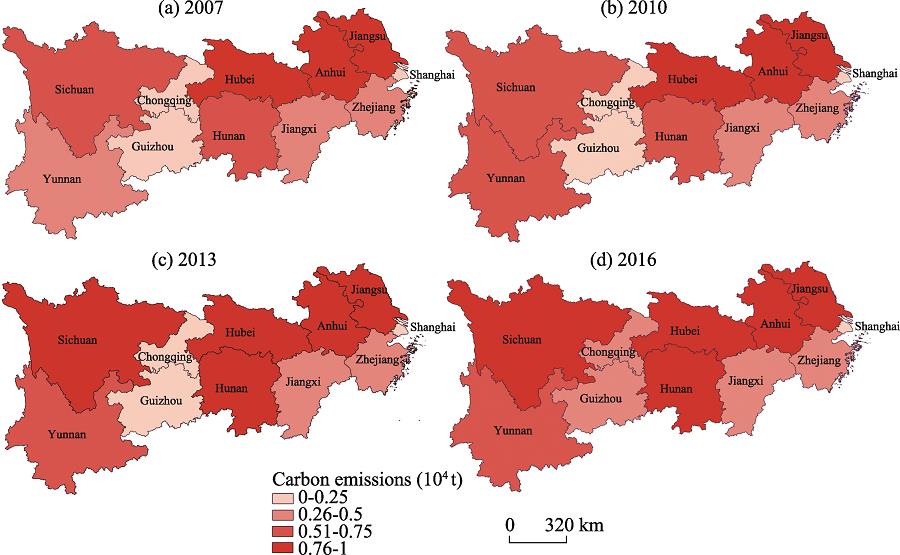
    Fig. 2. Spatiotemporal variations of cultivated CEs in the Yangtze River Economic Belt
    Kernel density map of CLU efficiency (CLUE) in the Yangtze River Economic Belt
    Fig. 3. Kernel density map of CLU efficiency (CLUE) in the Yangtze River Economic Belt
    SourceCoefficientUnitReference
    Tillage312.6kg/km2Wu et al., 2007
    Machinery0.18kg/kWWest et al., 2002
    Fertilizers0.8956kg/kgWest et al., 2002
    Pesticides4.9341kg/kgPost et al., 2000
    Plastic sheets5.18kg/kgLi et al., 2011
    Irrigation25kg/hm2Li et al., 2011
    Table 1.

    Carbon emission (CE) coefficients of major carbon sources arising from cultivated land use (CLU)

    IndicatorsData sources
    InputI1China Rural Statistical Yearbook (2008-2017)
    I2China Rural Statistical Yearbook (2008-2017)
    I3China Rural Statistical Yearbook (2008-2017)
    I4China Rural Statistical Yearbook (2008-2017)
    I5China Rural Statistical Yearbook (2008-2017)
    I6China Rural Statistical Yearbook (2008-2017)
    I7China Rural Statistical Yearbook (2008-2017)
    OutputO1China Rural Statistical Yearbook (2008-2017)
    O2China Rural Statistical Yearbook (2008-2017)
    O3$E=\sum{{{E}_{i}}}=\sum{{{T}_{i}}\cdot {{\delta }_{i}}}$, where Ti and δi are the values of each carbon source and the CE coefficient, respectively.
    Influencing factorsPCLand Survey Results Sharing Application Service Platform
    PGStatistical yearbooks of the provinces and cities in the YREB from 2008 to 2017
    PPStatistical yearbooks of the provinces and cities in the YREB from 2008 to 2017
    MPStatistical yearbooks of the provinces and cities in the YREB from 2008 to 2017
    ATEPS data platform
    PIChina Environmental Protection Database
    Table 2.

    Indicators and data sources

    RegionsYearAverage
    2007200820092010201120122013201420152016
    Shanghai28.2928.5526.0925.6325.1123.3622.8222.0220.9819.6024.24
    Jiangsu408.22408.29415.04414.50412.49409.01405.91404.10396.96389.90406.44
    Zhejiang145.38147.53149.13148.23149.11150.71151.63147.96145.89139.67147.52
    Anhui374.26379.77386.80398.38410.56416.34425.00426.57423.85410.36405.19
    Jiangxi189.09195.18199.31206.38207.07209.46209.83209.38210.11207.22204.30
    Hubei373.63401.05413.84425.33429.67429.97422.50420.44406.07397.02411.95
    Hunan295.49301.53311.39318.65325.22335.36337.70337.73336.21334.77323.40
    Chongqing103.84108.08113.40114.42119.03119.84120.78121.96122.94121.38116.57
    Sichuan304.20310.62319.02321.84328.94332.38330.97331.29331.91331.06324.23
    Yunnan201.27216.21222.93238.92257.23274.89285.33296.04302.46307.35260.26
    Huizhou99.88109.56112.01107.26117.48122.94122.89127.33130.09130.90118.03
    Total2523.542606.352668.972719.562781.902824.262835.342844.842827.472789.222742.14
    Table 3.

    CEs from CLU in the Yangtze River Economic Belt

    Region2007201020132016
    CCRSBMCCRSBMCCRSBMCCRSBM
    Shanghai0.91350.67280.98440.88531111
    Jiangsu110.98220.79220.99860.933811
    Zhejiang0.69570.41850.79970.57490.93210.779811
    Anhui0.90060.58600.91130.64190.89740.66330.95270.7483
    Jiangxi110.96530.79871111
    Hubei0.89220.56890.90170.57170.95760.758611
    Hunan0.94870.73180.94820.77200.94010.773811
    Chongqing0.99050.92670.98240.90870.99740.931911
    Sichuan110.97010.88810.97840.937111
    Yunnan0.71850.49930.65190.47530.74410.54310.78210.5461
    Huizhou110.98190.85950.86720.714111
    Table 4.

    CLUE for each province or city of the Yangtze River Economic Belt in specific years

    VariablesCoefficientStd. Err.ZSignificance
    PC-0.00044090.0001838-2.40.016
    PG3.14E-061.08E-062.90.004
    PP0.00007040.00002792.520.012
    MP-0.02083010.0070656-2.950.003
    AT0.05732150.02584762.220.027
    PI-1.16E-060.0000392-0.030.976
    Table 5.

    Regression results of CLUE using the Tobit model

    Xiang LUO, Xinhe AO, Zuo ZHANG, Qing WAN, Xingjian LIU. Spatiotemporal variations of cultivated land use efficiency in the Yangtze River Economic Belt based on carbon emission constraints[J]. Journal of Geographical Sciences, 2020, 30(4): 535
    Download Citation