
Lixin Yin, Zhichao Liu, Chunhui Liu. Surface Structure State Perception System Based on FBG Array[J]. Chinese Journal of Lasers, 2021, 48(24): 2406001
- Chinese Journal of Lasers
- Vol. 48, Issue 24, 2406001 (2021)
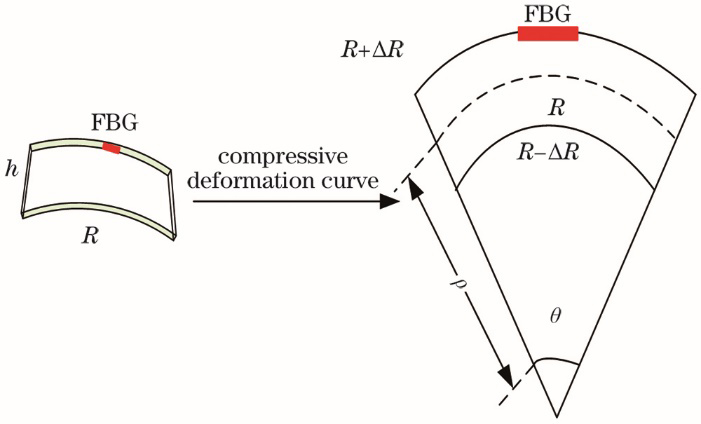
Fig. 1. Schematic diagram of micro-element segment before and after deformation
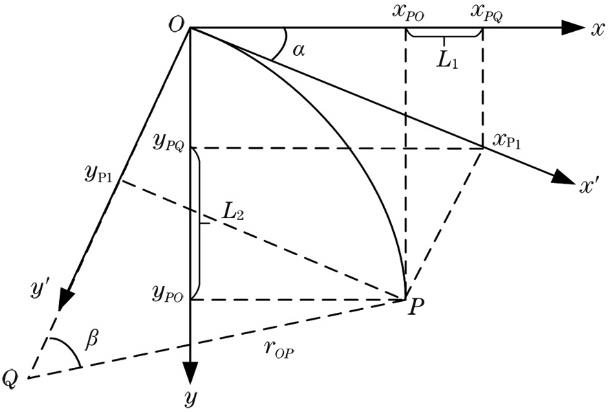
Fig. 2. Schematic diagram of coordinate conversion
Fig. 3. Surface strain distributions of structure to be tested. (a) Load is 40 N; (b) load is 100 N
Fig. 4. Schematic diagram of overall system structure
Fig. 5. Physical distribution diagram of experimental device
Fig. 6. Schematic diagrams of fiber wavelength offsets at different pressure points. (a) Pressure point is at s1; (b) pressure point is at s2; (c) pressure point is at s3; (d) pressure point is at s4; (e) pressure point is at s5; (f) pressure point is at s6; (g) pressure point is at s7; (h) pressure point is at s8; (i) pressure point is at s9
Fig. 7. Comparison and analysis diagram of actually measured strain values and simulated values
Fig. 8. Three-dimensional surface reconstruction by MATLAB
Fig. 9. Three-dimensional surface map after Qualify point cloud processing
| |||||||||||||||||||||||||||||||||||||||||||||
Table 1. Error analysis table when pressure point is at s2
| |||||||||||||||||||||||||||||||||||||||||||||
Table 2. Error analysis table when pressure point is at s9
| |||||||||||||||||||||||||||||||||||||||||||||
Table 3. Error analysis table when pressure point is at s7

Set citation alerts for the article
Please enter your email address
© Copyright 2018-2021 | Chinese Laser Press. All Rights Reserved 沪ICP备15018463号-20