Abstract
In recent years, flows of many rivers and lakes have become reduced in arid and semi-arid regions around the world. The most typical examples of this phenomenon occur in Central Asia, and the reduction of the Aral Sea area is closely related to agricultural water use. However, due to a lack of continuous data in Central Asia spanning many years, “virtual water” is used to evaluate changes in agricultural water use. Based on virtual water theory, 325 kinds of agricultural products in eight categories are selected as the research object, and changes in virtual water are calculated for Central Asia from 1992 to 2016. Results indicate that: (1) The average annual net export of agricultural virtual water (TVWNE) in Central Asia is about 9 billion m3, concentrated in Kazakhstan, whose annual TVWNE reaches 8.1 billion m 3. (2) Since 2007, the TVWNE in Central Asia has dropped significantly, with a drop rate of 86%, while the total volume of agricultural virtual water has gradually increased since 1998. (3) The upstream and downstream countries in Central Asia have different characteristics in the change of virtual water quantity.1 Introduction
One of the most important ecological and socio-economic problems in the 21st century is water shortage. In the 2015 annual risk report, the World Economic Forum ranked the “water crisis” as the world’s largest potential risk (World Global Risk 2015). According to data from the Food and Agriculture Organization (FAO) Global Water Information System, the world’s per capita renewable freshwater resources in 1962 were 13,402 m3, falling to 5921 m3 in 2014. This equates to a per capita freshwater resource decrease by nearly 1420 m³ every decade. According to the statistics, water resource problems are prominent in more than 80 countries in the world, with a total of 500 million people facing serious water shortages all year round, which restricts their social and economic development (Shi et al., 2014). One of the biggest pressures on freshwater resources is irrigation for food production; therefore, the rational use of agricultural water is a major challenge (Pierpaolo, 2018). According to estimates by FAO, with an increasing global population and rising diet levels, food demands will increase by over 60% by 2050. Therefore, it is essential to make water use more efficient in agriculture to help alleviate the global water crisis and reconfigure global water resources.
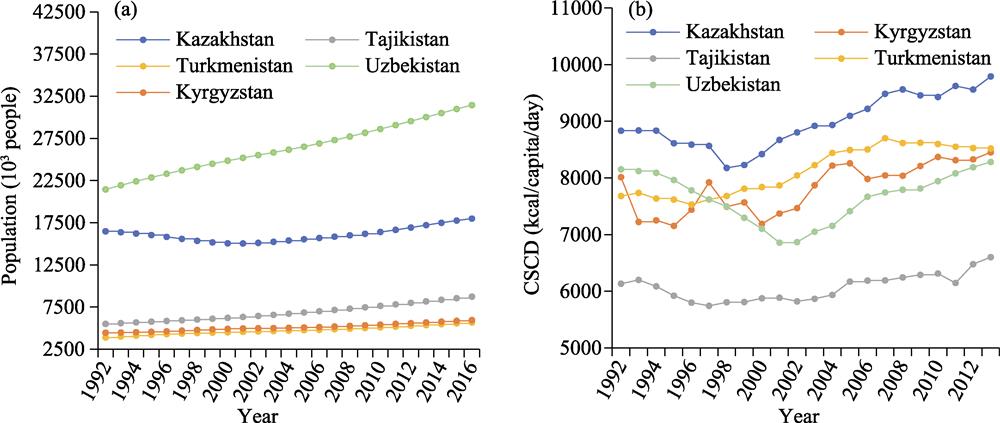
Water resource shortages in arid and semi-arid regions of the world directly affect human demand for water, food irrigation, and industrial production. As an arid and semi-arid region, Central Asia faces serious water problems and is listed as one of the seven high-risk areas for water disputes in the world (Hu et al., 2018). Therefore, solving the water shortage problem in Central Asia is of great significance for maintaining global stability and sustainable development (Yang et al., 2017; Yang et al., 2019). According to FAO data, from 1992 to 2016, the average annual volume of agricultural water use in the five Central Asian countries was 116 billion m3, and the average annual total of freshwater was 124 billion m3. Agricultural water in this area, therefore, accounts for 93% of the area’s total freshwater. Among the five Central Asian countries, the country with the highest ratio of agricultural water to total freshwater is Uzbekistan at 99%. Turkmenistan and Tajikistan follow with 96% and 94%, respectively. Below average are Kyrgyzstan and Kazakhstan, with 91% and 70%, respectively. Moreover, the changing trend of agricultural water use in Central Asian countries is the same as that of the freshwater supply. Therefore, changes in agricultural water use in Central Asia plays an important role in changes in freshwater supply, which means that it is important to study changes in virtual water over recent years for different crops in Central Asia to better formulate agricultural policies to alleviate water shortages. Notably, the population of Central Asia increased by nearly 20 million from 1992 to 2016, accompanied by a fast population growth rate. Among the five Central Asian countries, Uzbekistan had the fastest population growth rate at 47% (Figure 1). With development in the economy and improvements in living standards, the calorie supply per capita daily (CSCD) in Central Asia is gradually increasing. Therefore, Central Asian people need increased food support, which, in turn, means Central Asia needs increased water resources for food production.

Figure 1.
Population changes in Central Asia from 1992-2016 and CSCD changes in Central Asia from 1992-2013Therefore, studying the changes in agricultural water use in Central Asia has become very important for the sustainable development of the region.
However, there are many kinds of agricultural production, which makes it difficult to compare water use changes in a country with a small amount of water use data (Karimov et al., 2014). Virtual water is a useful tool for studying the changes in water use linked to various types of agricultural production. The concept of virtual water was put forward by Allan, and it refers to the amount of water resources needed to produce products and services; this endows the concept with profound ecological and economic importance (Allan, 1992). Virtual water strategy refers to the purchase of water-intensive agricultural products, mainly grains, by countries and regions with poor water resources from those with rich water resources through trade, so as to guarantee the water resources and food security of their own countries and regions (Chittaranjan, 2018).
Recent studies have focused on water issues in Central Asia from several perspectives;. First, these have included cross-border water conflicts. For example, Deng et al. (2010) introduced the cross-border water resources utilization problem in Central Asia. Yao et al. (2014) summarized cross-border water problems in Central Asia from the point of view of water mismanagement. Second, there are analyses related to the factor that influence the water use and basin water environments. For example, Abdullaev et al. (2015) described the analyses of historical transformation of water management in Central Asia. Third, there are also some studies related to agricultural water use in Central Asia. For example, Geerken et al. (2007)studied the impact of water resources on irrigated agriculture in Central Asia. Fourth, some scholars have studied virtual water trade. For example, Ding et al. (2020) conducted a spatiotemporal assessment of Kazakhstan’s agricultural virtual water. Zhu et al. (2020) and Meng et al. (2019) examined virtual water trade for several major food crops in Central Asia. However, this research does not adequately address the mitigation of water resource shortages from the perspective of agriculture virtual water in Central Asia. Only a few researchers, such as Liu et al. (2014), have quantitatively analyzed agricultural virtual water in Central Asian countries.
This study aims to calculate the flow of agricultural water resources for Central Asian countries accurately, using the method of virtual water, to better understand comprehensively the state of their agricultural water resources. On this basis, we analyze the causes of agricultural water resource change, put forward management measures for the efficient use of agricultural water resources (Borgomeo et al., 2020; Delbourg et al., 2020; Ma et al., 2020; Zhang et al., 2018), and explore the direction of agricultural development; these measures are used to promote the transformation of agricultural structure, alleviate the shortage of water, and optimize the structure of agricultural exports.
2 Study area
Central Asia is located within 50°-80°E and 35°-55°N and consists of five countries: Kazakhstan, Tajikistan, Kyrgyzstan, Turkmenistan, and Uzbekistan. Because it is located in the hinterland of Eurasia, far away from the oceans, Central Asia has a unique continental climate. Seasonal and daily temperature differences vary widely, and precipitation is sparse and mainly concentrated in spring and summer, especially in spring (Chen et al., 2018). The Amu Darya and the Syr River are the two main rivers in Central Asia, originating from the Pamirs, flowing westward into the Aral Sea. The rivers are the lifeline of irrigated agriculture. Cultivated land (about 8.0×10⁶ hm2) depends on surface water for irrigation, and irrigation water consumption of the two rivers accounts for 90% of the total water intake. In recent decades, the interception of the two rivers and other recharge rivers has dramatically reduced the amount of water injected into the Aral Sea. Upstream countries in Central Asia, such as Kyrgyzstan, have greatly increased the planting area of rice, and the associated agricultural water use has increased rapidly. Figure 2 shows the changes in area for major crops in Central Asia between 1992 and 2016. Water resources are the basis of agricultural development. The abundance of water resources is closely related to the development of agriculture. At present, water shortages coupled with uneven space-time distribution, a mismatched distribution of water and land resources, and significant water consumption in agriculture have made severe water resources a key factor in restricting sustainable economic development and social progress in Central Asia (Mekonnen et al., 2016).
Figure 2.
Changes in main crop planting areas in five Central Asian countries between 1992 and 20163 Data and methods
This study is based on the AQUASTAT database from FAO. According to the global average unit mass virtual water content of agricultural (VWC) and livestock products, the five Central Asian countries are used as research units. Using dynamic change analysis of the total virtual water production (TVWP), the total virtual water import (TVWI), and the total virtual water export (TVWE) of agriculture, this study focuses on the dynamic changes of agricultural virtual water in the five Central Asian countries from 1992 to 2016, and discusses the influencing factors of agricultural virtual water change.
Eight categories of agricultural products are included in this study, essentially covering all types of agricultural products in the FAO’s statistics for Central Asia, and fully reflecting the production and trade of such products. Thus, this paper uses the five Central Asian countries as the research area, and selects a total of more than 300 kinds of agricultural products as calculation objects.
To calculate the virtual water content of crops, we must calculate the water demand for agricultural production. The main factors affecting water demand are meteorological factors, including precipitation, temperature, and water pressure, as well as crop type, soil conditions, and planting times. Because of the lack of water use data for the agricultural products in Central Asia, it is impossible to accurately calculate their water demand. In addition, this paper mainly studies the dynamic changes in virtual water in Central Asia for the past 25 years. The focus is not on the calculation of the virtual water content of unit quality agricultural products. Therefore, the global average of the virtual water content of unit quality agricultural products is used to calculate the change of virtual water in Central Asia (Mekonnen et al., 2011; Mekonnen et al., 2012). Table 1 lists the unit mass virtual water content for some agricultural products.
| Product | VWC | Product | VWC | Product | VWC |
|---|
| Vegetables | 322 | Barley | 1423 | Grapes | 608 |
| Fruits | 967 | Maize | 1222 | Sugar crops | 197 |
| Cereals | 1644 | Rye | 1544 | Eggs | 3300 |
| Roots | 387 | Oat | 1788 | Milk | 1020 |
| Fodder crops | 253 | Potato | 287 | Chicken | 4325 |
| Oil crops | 2364 | Rice | 606 | Butter | 5553 |
| Tobacco | 2925 | Beans, dry | 5053 | Pig | 5988 |
| Fibres | 3837 | Cashew nuts | 14218 | Sheep | 10412 |
| Pulses | 4055 | Coconuts | 2687 | Cattle | 15415 |
| Spices | 7048 | Olives | 3015 | Fish | 5000 |
| Nuts | 9063 | Seed cotton | 4029 | Beer | 298 |
| Natural rubber | 13748 | Tomatoes | 214 | Wine | 869 |
| Wheat | 1827 | Oranges | 560 | Leather | 17093 |
| Rice, paddy | 1673 | Apple | 822 | Coffee | 1120 |
Table 1.
Global average water footprint of some primary crops and derived crop products (m3 ton-1)
The TVWP in agriculture includes the amount of water used for cereal production and the amount of water used for livestock production. The production method is used to calculate the agricultural production in water resource utilization. The calculation of virtual water is equal to the output of a certain agricultural product in a certain area times the VWC of the agricultural product and then sums up the total virtual water of all kinds of agricultural products—the formula is expressed as (3.1); the virtual water trade is obtained by multiplying the import or export volume of a certain agricultural product times the VWC of the agricultural product separately; the formula for calculating the virtual water import volume is expressed as (3.2) and the formula for calculating the virtual water export volume is expressed as (3.3):
where Pi is the output quantity of the i-th agricultural product, Ii is the import quantity of the i-th agricultural product, and Ei is the export quantity of the i-th agricultural product.
4 Results and analysis
4.1 Changes in TVWP of agriculture in five countries
The virtual water for the production and consumption of cereals and livestock products in Central Asia in 1992-2016 decreases and then increases, with 1998 as the turning point (Figure 3a). The reason for the decrease of the TVWP after 1992 is that after the disintegration of the Soviet Union, the Soviet government’s subsidies to agriculture in Central Asian countries dropped sharply; and water diversion of downstream countries, like Kazakhstan, decreased due to cross-border water disputes. Moreover, most agricultural machinery, which was dated, and the agricultural supplies were insufficient (Liu, 2017). In addition, the income of farmers and agricultural workers decreased, leading to a decrease in agricultural workers. Therefore, a reduction in sown area and grain production was inevitable.
Figure 3.
Changes in volume of agricultural virtual water in Central Asia from 1992 to 2016 (a. Changes in agricultural virtual water of the five countries; b. Changes in virtual water of the major agricultural productions in the study area)Changes in water virtual water varied country during the study period. First, it should be mentioned that Tajikistan’s seven-year civil war began in 1992, which was also a major factor resulting in the decrease of total agricultural production in Central Asia (Nourzhanov et al., 2013). In 1998, Tajikistan’s virtual water reached its lowest value at 5 billion m3. However, the Kazakhstan government enacted a compulsory agricultural insurance in 2003 and formulated strategies to improve the level of farmland irrigation and agricultural product processing (Hu et al., 2015). Additionally, Kazakhstan gradually increased water diversion after 2001 and invested more than 50 billion Tenge in agricultural development between 2003 and 2009. In 1994, the government of Turkmenistan adopted the “Ten Years of Prosperity” plan, one of the aims of which was to set targets for increased agricultural output (Sarah, 1997). Tajikistan relaxed restrictions on agricultural trade management and eliminated most government interventions, thus promoting diversification of crop production (Tashmatov et al., 2000). Therefore, the total production volume of agricultural virtual water rapidly increased after the Central Asian countries took measures to increase production; and the TVWP in Central Asia reached a maximum of 179.8 billion m3 in 2011. However, the TVWP was only 100.5 billion m³ in 1998. Therefore, compared with 1998, the growth rate of the TVWP in 2011 reached 56%, and the growth rate in 2016 reached 79%.
From the perspective of agricultural product types (Figure 3b), the type of agricultural products with the largest TVWP in Central Asia is cereals and feeds followed by livestock products. The least TVWP of virtual water is “fruits, vegetables, and nuts.” The main reason for the difference between different agricultural products is that waterlogging and salinization of soil are suitable for some salt-tolerant crops, such as wheat and cotton, but not for other salt-tolerant crops, such as tomatoes and some fruits.
4.2 Changes in TVWI of agriculture in five countries
From the perspective of a country’s import volume (Figure 4a), the country with the largest TVWI is Uzbekistan, with an average annual import volume of 4.6 billion m3; followed by Kazakhstan, with an average annual volume of TVWI of 4.3 billion m3; followed by Tajikistan, Kyrgyzstan, and Turkmenistan, with average annual volumes of TVWI of less than 2.5 billion m3. The results show that livestock products are the most imported in Kazakhstan, followed by tobacco, coffee, and cacao. The other four countries have common import features: cereals and feeds are the most imported, followed by livestock products. The TVWI in Kazakhstan increased year by year, but the TVWI in the other four countries decreased and then increased. The main reason for these trends is that Kazakhstan was the main grain planting base of the Soviet government during the Soviet Union period, while several other countries were adopted the “cotton at any price” policy by the Soviet Union. This means that when the Soviet Union disintegrated, Kazakhstan still had enough food for its own people, while other “cotton plantation” countries had to rely on imported food to survive. Therefore, with the agricultural reform and series of policies formulated by the Central Asian countries, the countries gradually achieved self-sufficiency regarding food production, thus reducing the TVWI. In addition, the per capita TVWI of agricultural products in 2016 increased by 104% compared with the lowest TVWI in 1999. This shows that the living standards of Central Asian people significantly improved.
From the perspective of import types (Figure 4b), the largest TVWI is for cereals and feeds, with an average annual import volume of 14.7 billion m3. The main reason for this is that after the disintegration of the Soviet Union, there was insufficient food for people in the country to survive, so it was necessary to import large amounts of food. Followed by livestock products with 2.5 billion m3, mainly chicken, beef, and mutton, which is mainly to meet people’s demand for protein. In addition, the TVWI of fruits, vegetables and nuts, tobacco, coffee, and cacao increased year by year. This was mainly because the country was not suitable for producing these types of crops, and the production process was relatively dated, so it was necessary to import these kinds of products.
Figure 4.
Total import volume of agricultural virtual water in Central Asia from 1992 to 2016 (a. Changes in agricultural virtual water imports of the five countries; b. Changes in agricultural virtual water imports of the major crops in the study area)4.3 Changes in TVWE of agriculture in five countries
From the perspective of a country’s total export volume (Figure 5a), the country with the largest TVWE is Kazakhstan, with an average annual TVWE of 12.3 billion m3; followed by Uzbekistan, with an average annual TVWE volume of 6.8 billion m3; followed by Turkmenistan, Kyrgyzstan, and Tajikistan. The main reason for the difference between these countries is that Kazakhstan and Uzbekistan are both large agricultural countries with large crop cultivation areas. Kyrgyzstan and Tajikistan are both upstream countries with small land areas and complex terrain, the qualities of which are not suitable for the large-scale cultivation of crops.
Figure 5.
TVWE in Central Asia from 1992 to 2016 (a. Changes in agricultural virtual water exports of the five countries; b. Changes in agricultural virtual water exports of the major crops)In addition, the TVWE in Kazakhstan increased year by year, and the TVWE in Uzbekistan decreased year by year. Since Kazakhstan’s cultivated land area increased significantly, but its population did not greatly increase (Figure 1), its TVWE had an increasing trend (Tan et al., 2018). The decrease in TVWE for Uzbekistan was due to a rapid population growth of about 47%. In addition, Uzbekistan is committed to giving priority to improving the living standards of its people (Zhu, 2012).
From the perspective of export types (Figure 5b), the largest TVWE is for cereals and feeds, and is increasing. The average annual TVWE of cereals and feeds reaches 17.9 billion m3; followed by that of non-edible agricultural raw materials, mainly cotton lint and cotton linter at 9.5 billion m3. However, from 1992 to 2006, the TVWE of non-edible agricultural raw materials was the greatest, followed by that of grain, mainly because Central Asian countries predominantly planted cotton. During the study period, the Central Asian countries have adjusted the proportion of wheat and cotton planting, reducing the cultivation of cotton and increasing the planting area of wheat, potatoes, and fruits and vegetables, which is conducive to soil improvement and self-recovery. Therefore, the TVWE of cereals and feeds continued to grow, while the TVWE of non-edible agricultural raw materials declined. In addition, the crops exported in large quantities were rough processed crops, such as wheats, tomatoes, wool, and unmanufactured tobacco. Therefore, the production and processing technologies in Central Asia need to be improved. Only after improvement can Central Asia, which is short of water resources, realize sustainable development.
The virtual water volume of agriculture in Central Asia is currently in an overall trade surplus (Figure 6), and the average annual TVWNE is about 9 billion m³. Among the five Central Asian countries, the virtual water trade of agricultural products in Kazakhstan was in a net export state, with an average annual TVWNE of 8.1 billion m³ during the study period. Therefore, Kazakhstan has greatly increased the average annual TVWNE of Central Asia, which has exacerbated the shortage of water resources of Central Asia to a large extent. In recent years, the TVWNEs of all the countries, except Kazakhstan, have decreased year by year, maintaining a net import status. However, this still cannot make up for the loss of water resources caused by Kazakhstan’s excessive exports.
Figure 6.
TVWNE in Central Asia from 1992 to 2016Therefore, against the background of shrinking Aral Sea lake and rising food consumption, Central Asia is still a region with a net export of water resources; this affects the sustainable development of the region, exacerbating its attendant ecological crisis (Zhai et al., 2018).
5 Conclusions and policy implications
5.1 Conclusions
This paper calculates and analyzes changes in Central Asia’s agricultural TVWP, TVWI, and TVWE from the perspective of virtual water. The conclusions are as follows:
(1) After the disintegration of the Soviet Union, some countries were independent, which resulted in a rapid decline in agricultural TVWP in Central Asia from 1992 to 1998. With an increasing population and improvement in economic conditions, the TVWP of agriculture increased gradually after 1998. Among the five Central Asian countries, Uzbekistan and Kazakhstan consumed the largest amount of virtual water for agriculture. In addition, the categories with the most obvious increase in TVWP in Central Asia were cereals, fruits, vegetables and nuts, oils, and livestock products, which reflects the improving quality of life in Central Asia.
(2) From 1992 to 2016, the TVWI volume of agriculture in Central Asia exceeded the TVWE for only three years. In addition, the total TVWE of rice in the 25 years reached 850,000 tons, totaling 1.4 billion m3 of virtual water. This will definitely aggravate the water shortage in Central Asia. However, in recent years, the TVWE volume of agriculture has gradually decreased.
(3) In terms of export trade, the five Central Asian countries must strengthen their cooperation, achieve regional integrated development, and build a risk-prevention mechanism of trade to avoid food crises and water crises.
(4) In the future, with growth in living standards and an increasing population, the demand for agricultural water will be greater in Central Asia. Therefore, it is necessary to make reasonable and effective policies that solve the shortage of water resources.
5.2 Policy implications
Based on our results, the following suggestions are proposed for achieving the use of agricultural water resources sustainably and efficiently in Central Asia:
(1) Change water resources use strategy and control the output of high-water consumption agricultural products. In the past 25 years, the TVWI volume of agriculture in Central Asia has exceeded the TVWE for only 3 years, and the total net of TVWE in the 25 years is 220.1 billion m3. Therefore, control of the output of high-water consumption agricultural products is essential to alleviate pressure on water resources in Central Asia.
(2) Optimize the structure of agricultural planting and control the planting scale of high-water consumption agriculture. In the past 25 years, the TVWP of agriculture in Central Asia has generally increased. In addition, the total area where rice is harvested—rice being a high water-consuming crop—continues to increase. In recent years, Kazakhstan and Uzbekistan, two downstream countries, have begun to optimize the planting structure and reduce the planting area of rice. At present, Uzbekistan’s rice planting area is 72,000 ha, less than half of that in 1992, providing a case for optimizing the planting structure for the other four countries.
(3) Develop water-saving agriculture, increase agricultural investment, and implement water-saving technology sharing. The principle of water-saving agriculture is to improve the utilization of water resources and reduce waste, which is key to achieving the sustainable supply of water resources and meeting food demand (Xue et al., 2017). At present, the irrigation equipment of Central Asian countries is aged, as are the traditional irrigation methods (Wu et al., 2010). Therefore, the use of new irrigation equipment and the repair of old irrigation equipment play an important role in improving the utilization of water resources. For example, in recent years, the “Kazakhstan-2050” strategy has involved the goal of “introducing the most advanced groundwater collection and water-saving technologies,” indicating the pressing need of developing water-saving agriculture (Chen, 2013).
Based on virtual water theory, this paper takes the five Central Asian countries as the basic unit of state and uses the period 1992-2016 as a time scale to calculate the virtual water of agriculture in Central Asia, and to describe the dynamic changes in virtual water. Due to the lack of field research and more accurate data, the analysis of agricultural water resources in Central Asia is simple. In the future, more detailed research should be carried out while observing the following:
(1) Combine local meteorological data, differences in agricultural production techniques, and differences in the natural environment to accurately quantify the unit content of virtual water in agricultural products.
(2) Research time scales can be accurate to quarterly changes in order to explore the time distribution of water resources in Central Asia. In this way, we can make better strategies to ease water shortages; this is necessary for maintaining regional and even global water security and achieving sustainable development of water resources.
References
[1] AllanJ A. Substitutes for water are being found in the Middle East and North Africa. GeoJournal, 28, 375-385(1992).
[2] BorgomeoE, Al-MudaffarFawzi N, HallJ W et al. Tackling the trickle: Ensuring sustainable water management in the Arab region. Earth’s Future, 8(2020).
[3] ChenX. Development status of agriculture in Kazakhstan. World Agriculture, 12, 155-158(2013).
[4] ChenX, WangS, HuZ et al. Spatiotemporal characteristics of seasonal precipitation and their relationships with ENSO in Central Asia during 1901-2013. Journal of Geographical Sciences, 28, 1341-1368(2018).
[5] ChittaranjanR, DavidM, MatthewS. Virtual water: Its implications on agriculture and trade. Water International, 43, 717-730(2018).
[6] DabrowskiJ M, MurrayK, AshtonP J. Agricultural impacts on water quality and implications for virtual water trading decisions. Ecological Economics, 68, 1074-1082(2009).
[7] DelbourgE, DinarS. The globalization of virtual water flows: Explaining trade patterns of a scarce resource. World Development, 131(2020).
[8] DengM, LongA, LiX et al. An analysis of the exploitation, cooperation and problems of transboundary water resources in the five Central Asian countries. Advances in Earth Science, 25, 1337-1346(2010).
[9] DingY K, LiY P, LiuY R. Spatial-temporal assessment of agricultural virtual water and uncertainty analysis: The case of Kazakhstan (2000-2016). Science of the Total Environment, 724(2020).
[10] HuW, LiuH, BaoA et al. Influences of environmental changes on water storage variations in Central Asia. Journal of Geographical Sciences, 28, 985-1000(2018).
[11] HuY, LiD. The level of agricultural policy support, structural characteristics and reform orientation in Kazakhstan. World Agriculture, 81-84,116(2015).
[12] KarimovA K, ?im?nekJ, HanjraM A et al. Effects of the shallow water table on water use of winter wheat and ecosystem health: Implications for unlocking the potential of groundwater in the Fergana Valley (Central Asia). Agricultural Water Management, 131, 57-69(2014).
[13] LiuH, LvG, HeX et al. Evaluation of virtual water strategy in Turkmenistan. Journal of Economics of Water Resources, 32(6): 7-11, 24, 69(2014).
[14] LiuJ. Agricultural development and land reform in Kazakhstan. World Agriculture, 6, 104-108(2017).
[15] MaW J, OppC, YangD W. Spatiotemporal supply-demand characteristics and economic benefits of crops water footprint in semi-arid region. Science of the Total Environment(2020). https://www.ncbi.nlm.nih.gov/pubmed/12320385
[16] MekonnenM M, HoekstraA Y. The green, blue and grey water footprint of crops and derived crop products. Hydrology and Earth System Sciences, 15, 1577-1600(2011).
[17] MekonnenM M, HoekstraA Y. A global assessment of the water footprint of farm animal products. Ecosystems, 15, 401-415(2012).
[18] MekonnenM M, HoekstraA Y. Four billion people facing severe water scarcity. Science Advances, 2(2016). https://www.ncbi.nlm.nih.gov/pubmed/26933692
[19] MengF X, XiaX M, HuY C et al. Virtual water in trade between China and typical countries along the Belt and Road. Engineering Sciences, 21, 92-99(2019).
[20] NourzhanovK, BleuerC. Tajikistan: A Political and Social History. Place of Publication:Canberra ACT 0200(2013).
[21] O’HaraS L. Irrigation and land degradation: Implications for agriculture in Turkmenistan, Central Asia. Journal of Arid Environments, 37, 165-179(1997).
[22] SacconP. Water for agriculture, irrigation management. Applied Soil Ecology, 123, 793-796(2018).
[23] ShiW, WangM, GuoW. Long-term hydrological changes of the Aral Sea observed by satellites. Journal of Geophysical Research: Oceans, 119, 3313-3326(2014).
[24] TanM, LiY. Spatial and temporal variation of cropland at the global level from 1992 to 2015. Journal of Resources and Ecology, 10, 235-245(2019).
[25] TashmatovA, AknazarovF, JuraevA et al. Food policy reforms for sustainable agricultural development in Uzbekistan, the Kyrgyz Republic, and Tajikistan. Food Policy, 25, 719-732(2000).
[26] WhiteC J, TantonT W, RycroftD W et al. The impact of climate change on the water resources of the Amu Darya Basin in Central Asia. Water Resources Management, 28, 5267-5281(2014).
[27] WorldEconomic Forum. Global Risks 2015. 10th ed. World Economic Forum, Geneva. Switzerland(2015).
[28] WuM, ZhangX, LuoG et al. Situation of water resources utilization in Kazakhstan. Arid Land Geography, 33, 196-202(2010).
[29] XueJ, GuanH, HuoZ et al. Water saving practices enhance regional efficiency of water consumption and water productivity in an arid agricultural area with shallow groundwater. Agricultural Water Management, 194, 78-89(2017).
[30] YangS, YuX, DingJ et al. A review of water issues research in Central Asia. Acta Geographica Sinica, 72, 79-93(2017).
[31] YangY, LiX, DongW et al. Assessing China’s human-environment relationship. Journal of Geographical Sciences, 29, 1261-1282(2019).
[32] YaoH, ZhouH. A review of transboundary water resources in Central Asia. Resources Science, 36, 1175-1182(2014).
[33] ZhaiL, MaJ, LiG. Evolution and outlook of agricultural policies in Central Asian countries. Agricultural Outlook, 153, 31-35(2018).
[34] ZhangJ, ChenY, LiZ. Assessment of efficiency and potentiality of agricultural resources in Central Asia. Journal of Geographical Sciences, 28, 1329-1340(2018).
[35] ZhuQ. Looking at agricultural development in Uzbekistan. China Agricultural Information, 19, 32-33(2012).
[36] ZhuZ M, LiX Q, HuangY C. Provision-virtualized water trading net work along “The Belt and Road”. Resources & Industries, 22, 1-12(2020).