• Chinese Journal of Lasers
  • Vol. 50, Issue 22, 2211001 (2023)
Jinmei Wang**, Jianshu Lu, Peichao Zheng*, Shaojian Liu, Gang Li, and Guanghui Chen
Author Affiliations
  • Chongqing Municipal Key Laboratory of Photoelectric Information Sensing and Transmission Technology, College of Optoelectronic Engineering, Chongqing University of Posts and Telecommunications, Chongqing 400065, China
  • show less
    DOI: 10.3788/CJL230520 Cite this Article Set citation alerts
    Jinmei Wang, Jianshu Lu, Peichao Zheng, Shaojian Liu, Gang Li, Guanghui Chen. Study on Alkalinity Measurement of Sinter Based on LIBS Technology Combined with Internal Standard Method[J]. Chinese Journal of Lasers, 2023, 50(22): 2211001 Copy Citation Text show less
    Experimental diagram of LIBS
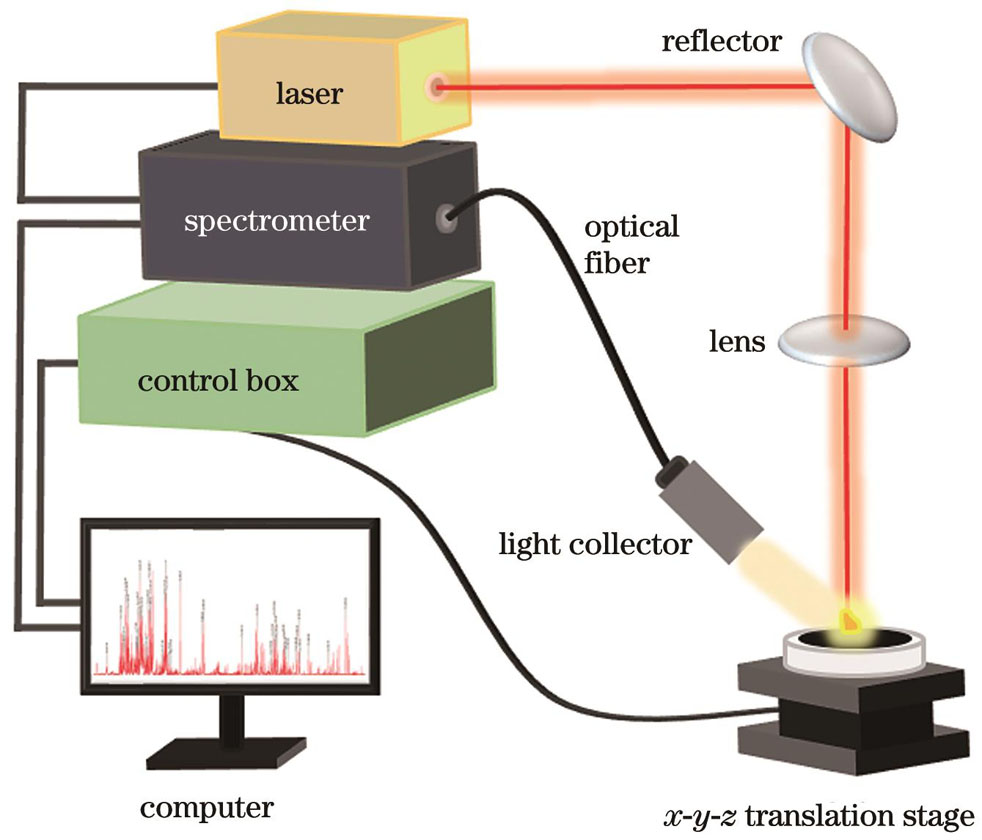
    Fig. 1. Experimental diagram of LIBS
    LIBS of sinter
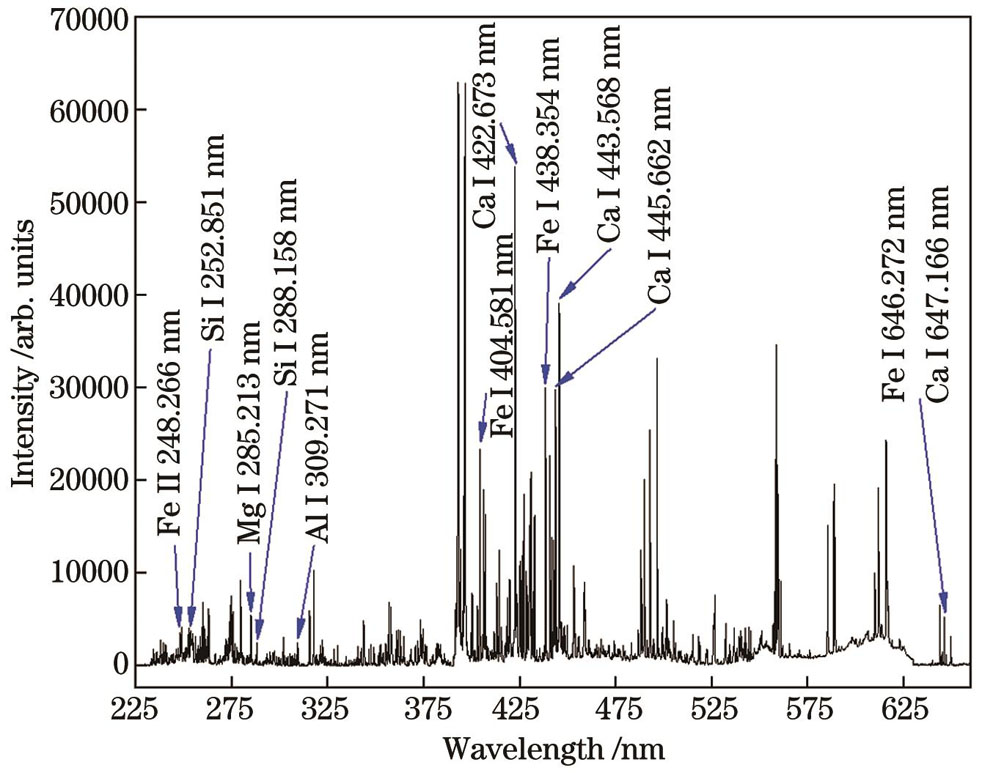
    Fig. 2. LIBS of sinter
    Effects of pressures on spectral signals of Fe, Si,and Ca. (a) Signal stability; (b) signal intensity
    Fig. 3. Effects of pressures on spectral signals of Fe, Si,and Ca. (a) Signal stability; (b) signal intensity
    Effects of laser energy on spectral signals. (a) Fe Ⅱ 248.266 nm; (b) Si Ⅰ 288.158 nm; (c) Ca Ⅰ 647.166 nm
    Fig. 4. Effects of laser energy on spectral signals. (a) Fe Ⅱ 248.266 nm; (b) Si Ⅰ 288.158 nm; (c) Ca Ⅰ 647.166 nm
    Effects of delay time on spectral signals of laser-induced sinter samples. (a) Fe Ⅱ 248.266 nm; (b) Si Ⅰ 288.158 nm;(c) Ca Ⅰ 647.166 nm
    Fig. 5. Effects of delay time on spectral signals of laser-induced sinter samples. (a) Fe Ⅱ 248.266 nm; (b) Si Ⅰ 288.158 nm;(c) Ca Ⅰ 647.166 nm
    Test results of spectral signal stability of different elements. (a) Fe element; (b) Si element; (c) Ca element
    Fig. 6. Test results of spectral signal stability of different elements. (a) Fe element; (b) Si element; (c) Ca element
    Calibration curves before processing by internal standard method. (a) Intensity ratio of Ca Ⅰ 647.166 nm and Si Ⅰ 288.158 nm; (b) intensity ratio of Ca Ⅰ 422.673 nm and Si Ⅰ 288.158 nm
    Fig. 7. Calibration curves before processing by internal standard method. (a) Intensity ratio of Ca Ⅰ 647.166 nm and Si Ⅰ 288.158 nm; (b) intensity ratio of Ca Ⅰ 422.673 nm and Si Ⅰ 288.158 nm
    Calibration curves after processing by internal standard method. (a) r1/r2; (b) r3/r2
    Fig. 8. Calibration curves after processing by internal standard method. (a) r1/r2; (b) r3/r2
    Sample No.Mass fraction /%Alkalinity
    TFeCaOSiO2
    A-153.5610.327.371.40
    A-254.1110.276.221.65
    B-154.6210.475.521.90
    A-353.3212.275.702.15
    A-452.8113.065.442.40
    A-552.4513.975.372.60
    A-653.8910.316.881.50
    A-753.6412.125.772.10
    B-254.6910.525.961.76
    B-355.0410.525.461.93
    Table 1. Main components and alkalinity values of 10 sintered ore samples
    Emission lineE/cm-1E /cm-1
    Si Ⅰ 288.158 nm6298.85040991.884
    Ca Ⅰ 422.673 nm023652.304
    Ca Ⅰ 647.166 nm20371.00035818.713
    Fe Ⅱ 248.266 nm040257.314
    Fe Ⅰ 438.354 nm11976.23934782.421
    Fe Ⅰ 646.272 nm19788.25135257.324
    Table 2. Energy level values of analytical spectral lines
    Sample No.XRFAlkalinityRelative error /%
    Before processing by internal standard methodAfter processing by internal standard methodBefore processing by internal standard methodAfter processing by internal standard method
    A-61.501.221.51-18.670.67
    A-72.102.222.115.710.48
    B-21.763.141.7878.411.14
    B-31.931.271.92-34.20-0.52
    Table 3. Comparison and analysis of alkalinity prediction results
    Jinmei Wang, Jianshu Lu, Peichao Zheng, Shaojian Liu, Gang Li, Guanghui Chen. Study on Alkalinity Measurement of Sinter Based on LIBS Technology Combined with Internal Standard Method[J]. Chinese Journal of Lasers, 2023, 50(22): 2211001
    Download Citation