
Cao Yang, Zhao Lin, Peng Yun, Ma Chengyong, Tian Zhiling, Zhong Minlin. Effect of Heat Input on Microstructure and Mechanical Properties of Laser Welded Medium Mn Steel Joints[J]. Chinese Journal of Lasers, 2018, 45(11): 1102008
- Chinese Journal of Lasers
- Vol. 45, Issue 11, 1102008 (2018)
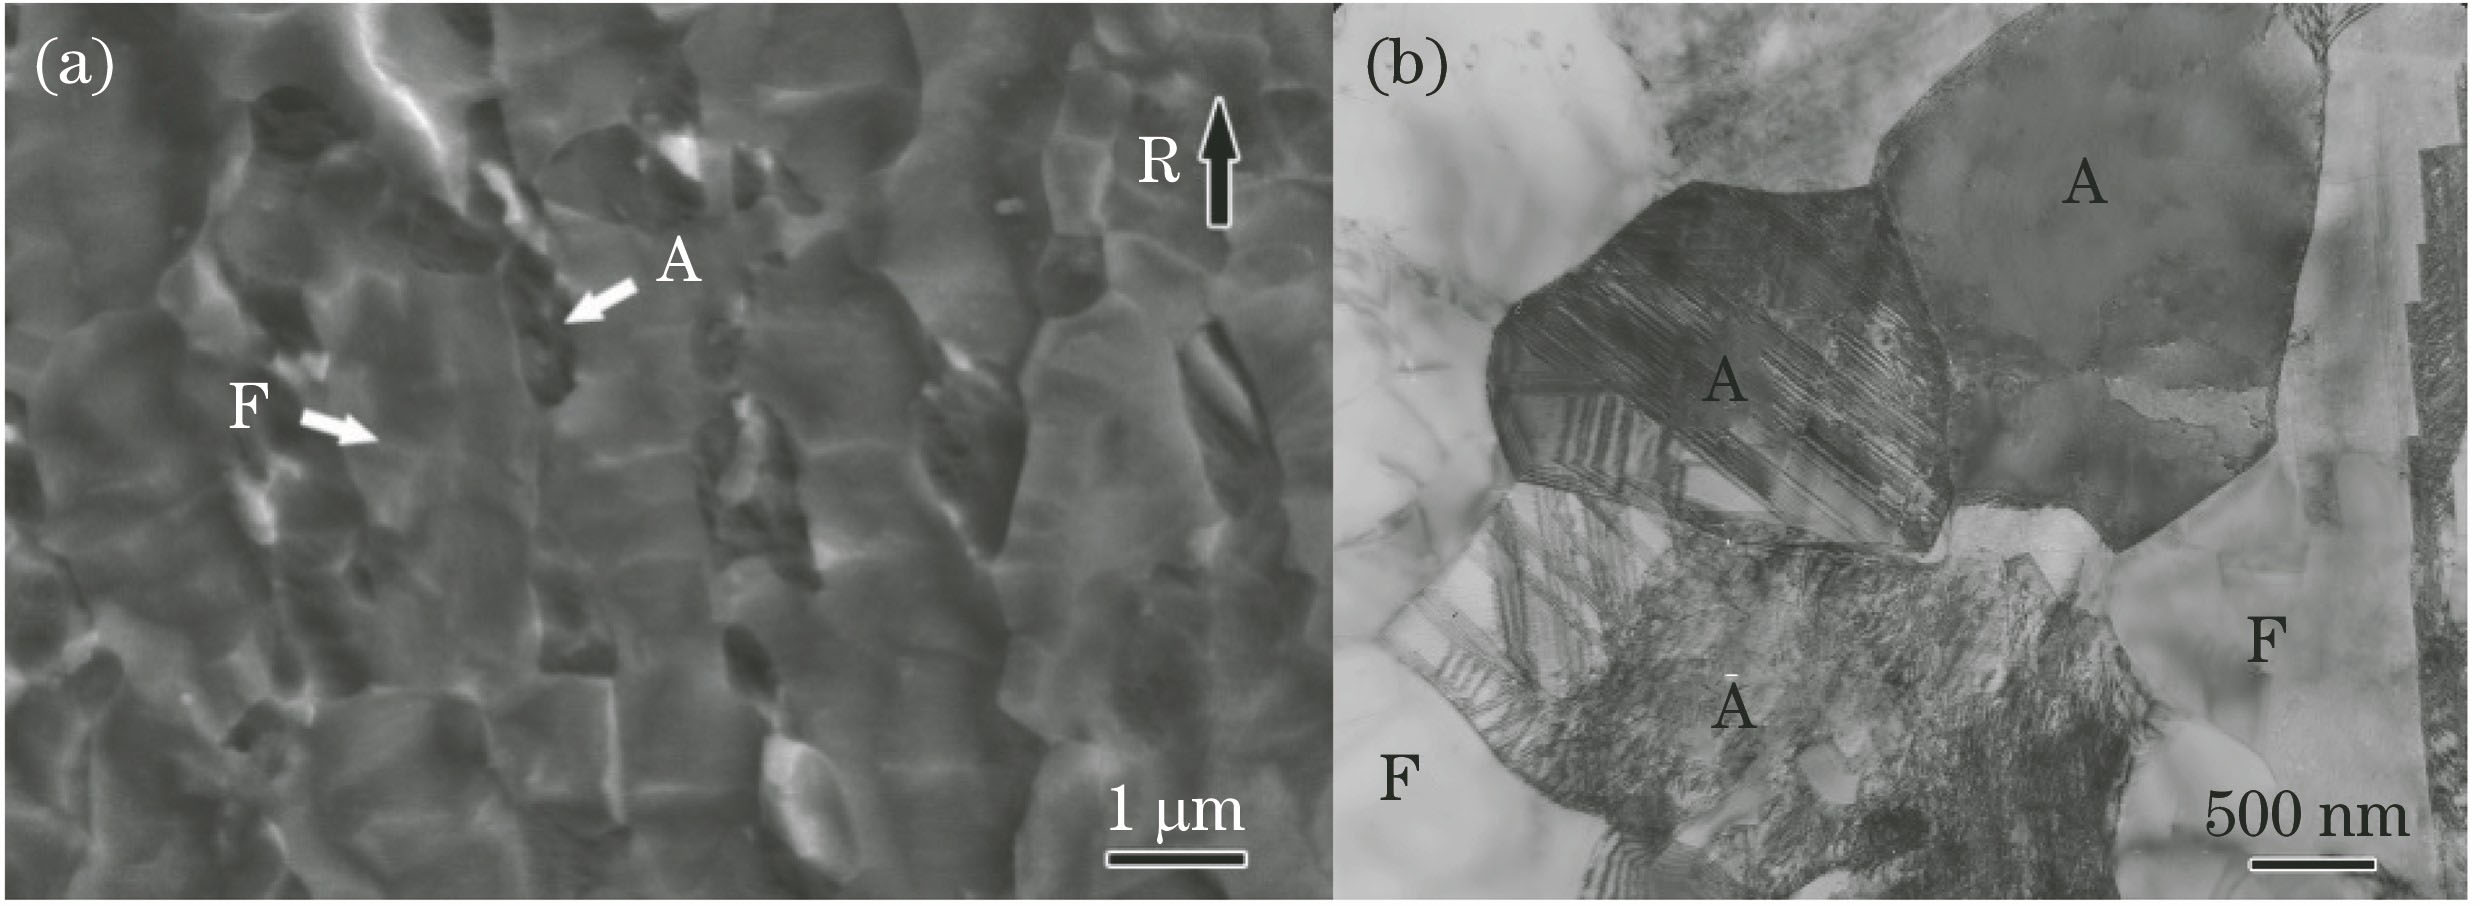
Fig. 1. Microstructures of 0.1C-5Mn medium Mn steel. (a) Under scanning electron microscope; (b) under transmission electron microscopy
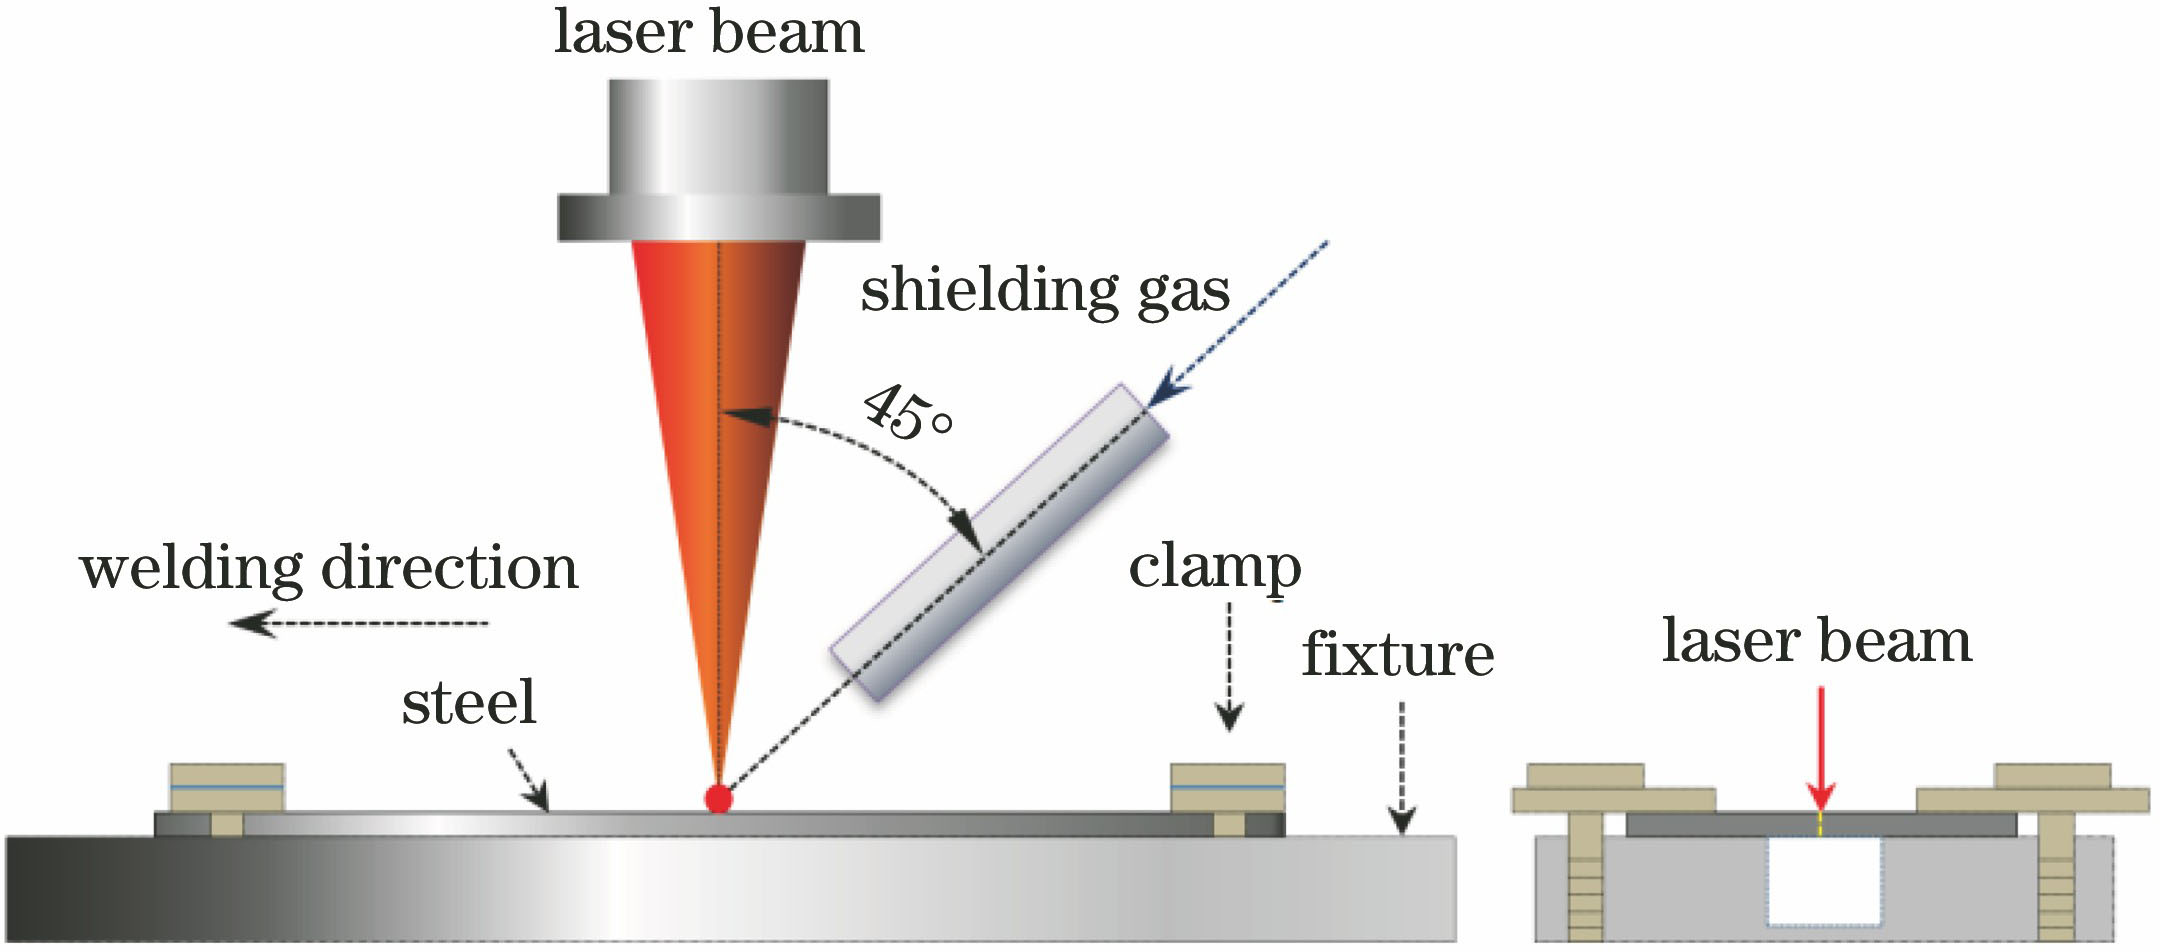
Fig. 2. Schematic of laser welding
Fig. 3. Size of tensile specimen
Fig. 4. Metallographic images of joints. (a) HH; (b) LH
Fig. 5. Microstructure morphologies of HAZs in HH joint. (a) FZ; (b) CGHAZ; (c) FGHAZ; (d) ICHAZ; (e) SCHAZ
Fig. 6. Microstructure morphologies of HAZs in LH joints. (a) FZ; (b) FL; (c) FGHAZ; (d) ICHAZ; (e) SCHAZ
Fig. 7. Morphologies of FZs in joints after corrosion. (a) HH, SEM; (b) LH, SEM; (c) HH, TEM; (d) LH, TEM
Fig. 8. Microhardness distributions of joints. (a) HH; (b) LH
Fig. 9. Tensile test results of joints and base materials. (a) Stress-strain curves; (b) local magnification of stress-strain curves; (c) tensile samples
Fig. 10. Morphologies. (a) Base material and joints; (b) fractures in base material; (c) fracture in LH joint; (d) fracture in HH joint
Fig. 11. Erichsen value of tailor-welded blank
Fig. 12. Morphologies of samples after tailor-welded blank Erichsen test
|
Table 1. Chemical compositions of 0.1C-5Mn medium Mn steel (mass fraction, %)
|
Table 2. Process parameters for laser welding
|
Table 3. Mechanical properties of joints and base materials

Set citation alerts for the article
Please enter your email address
© Copyright 2018-2021 | Chinese Laser Press. All Rights Reserved 沪ICP备15018463号-20