• Acta Photonica Sinica
  • Vol. 51, Issue 5, 0517001 (2022)
Min CHEN1、2、3, Gaofang YIN1、3、*, Nanjing ZHAO1、3、*, Tingting GAN1、2、3, Mengyuan GU1、2、3, Peilong QI1、2、3, Zhichao DING1、2、3, Lu WANG1、2、3, Chun FENG1、2、3, and Xiaoling ZHANG4
Author Affiliations
  • 1Key Laboratory of Environmental Optics and Technology,Anhui Institute of Optic and Fine Mechanics,Hefei Institutes of Physical Science,China Academy of Sciences,Hefei 230031,China
  • 2University of Science and Technology of China,Hefei 230026,China
  • 3Key Laboratory of Optical Monitoring Technology for Environment,Hefei 230031,China
  • 4Anhui University,Hefei 230039,China
  • show less
    DOI: 10.3788/gzxb20225105.0517001 Cite this Article
    Min CHEN, Gaofang YIN, Nanjing ZHAO, Tingting GAN, Mengyuan GU, Peilong QI, Zhichao DING, Lu WANG, Chun FENG, Xiaoling ZHANG. Relationship between Photosynthetic Fluorescence Parameters of Algae and the Initial Biomass in the Measurement of Water Quality Biological Toxicity[J]. Acta Photonica Sinica, 2022, 51(5): 0517001 Copy Citation Text show less
    Under short-term stress,the toxic response of 11 photosynthetic fluorescence parameters corresponding to different initial chlorophyll concentrations to 10 ug·L-1 DCMU
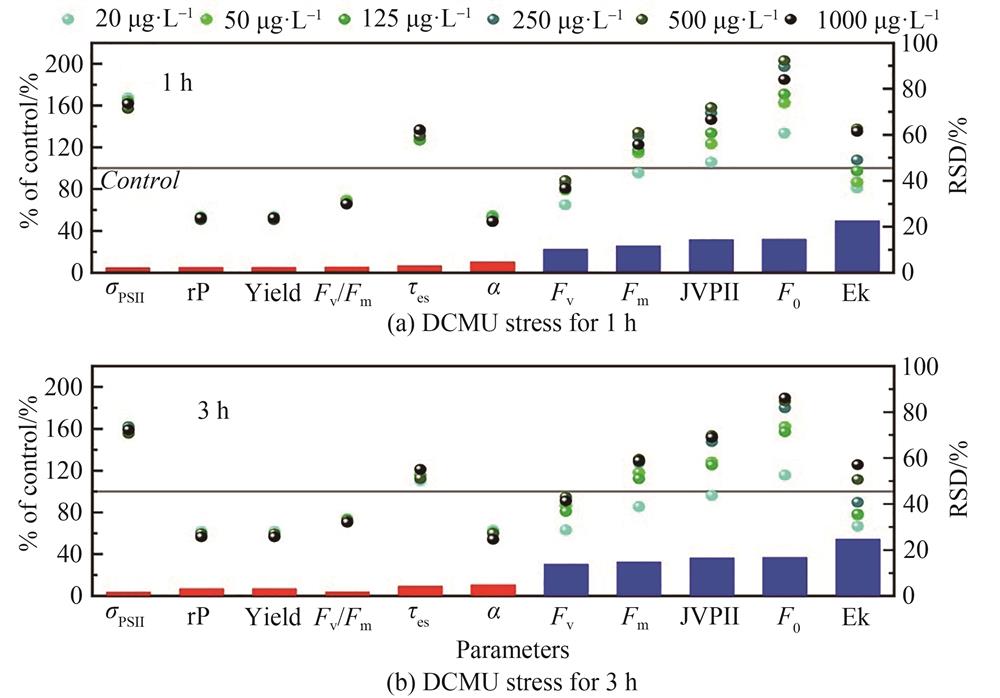
    Fig. 1. Under short-term stress,the toxic response of 11 photosynthetic fluorescence parameters corresponding to different initial chlorophyll concentrations to 10 ug·L-1 DCMU
    The trend of 11 photosynthetic fluorescence parameters with chlorophyll concentration
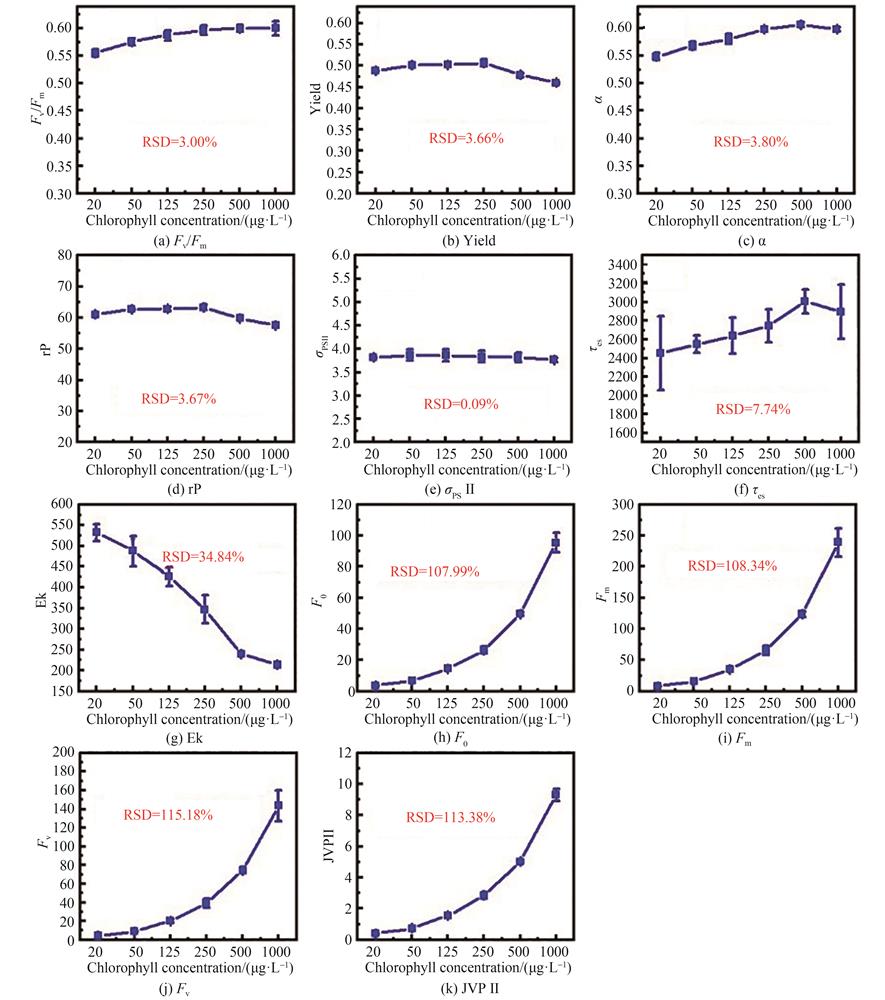
    Fig. 2. The trend of 11 photosynthetic fluorescence parameters with chlorophyll concentration
    The value of the parameter and the corresponding DCMU toxicity data EC20 change trend with the initial chlorophyll concentration
    Fig. 3. The value of the parameter and the corresponding DCMU toxicity data EC20 change trend with the initial chlorophyll concentration
    ParameterDescription
    F0Minimum fluorescence yield(measured at open reaction centres state)
    FmMaximal fluorescence output(measured at closed reaction centres state)
    FvVariable fluorescence yield,Fv=Fm-F0
    Fv/FmThe maximum photochemical quantum yield of PSII
    YieldThe effective quantum yield of PSII photochemical energy conversion
    αMaximal light utilization coefficient,initial slope of the rP-E curve
    rPRelative PSII electron transfer rate
    EkThe onset of light saturation
    σPSⅡAbsorption cross section of PSII photochemistry(without ambient light)
    τesTime constant associated with the re-opening of a closed RCII with an empty QB site
    JVPⅡPSII flux per unit volume
    Table 1. Photosynthetic fluorescence parameters obtained from FRRf14
    ParameterInitial chlorophyll concentration/μg·L-1Recommended concentration/(μg·L-1
    410201002005001 0002 000
    Fv/FmEC50>4015.3315.5815.7515.3516.0516.6217.1610~2 000
    EC206.833.213.303.172.993.423.373.43
    R20.9870.9980.9990.9970.9970.99411
    YieldEC5010.767.317.136.836.616.746.638.5610~2 000
    EC203.331.721.631.681.661.731.952.10
    R20.9990.99710.98710.99810.996
    αEC5011.577.766.436.246.216.126.667.1610~2 000
    EC203.782.101.841.861.811.932.342.20
    R20.9990.9890.9990.98710.99410.998
    rPEC5010.967.847.136.836.616.716.648.5410~2 000
    EC203.331.751.661.681.641.731.962.21
    R20.9990.99610.99710.99810.996
    σPSⅡEC5018.904.324.294.083.803.953.803.4610~2 000
    EC203.651.281.021.171.271.221.131.30
    R20.9880.9790.9980.9840.9820.9240.9000.976
    τesEC508.945.134.8544.854.434.454.684.6510~2 000
    EC205.182.021.931.921.761.992.242.34
    R20.9890.9880.99910.99910.9990.999
    EkEC50>40------>40-
    EC2020.518------2.084 88
    R20.526------0.625
    F0EC508.117.856.275.492.252.352.66-200~1 000
    EC202.162.432.532.56<11.0011.00-
    R20.8760.8870.972110.9930.991-
    FmEC50>40>40>40>40>40>40>40-200~1 000
    EC208.807.666.385.233.533.383.59-
    R20.8670.8340.8100.8790.9860.9830.962-
    FvEC50>40>40>40>40>40>40>40>40200~1 000
    EC2016.1015.7415.4214.7911.7010.439.788.40
    R20.9910.9840.9950.9860.9670.9520.9980.650
    JVPⅡEC50-->40------
    EC20--5.289-----
    R2--0.666-----
    Table 2. DCMU-related toxicity data(μg·L-1)and dose-effect curve fitting effect(R2)obtained by photosynthetic fluorescence parameters under different initial biomass
    Min CHEN, Gaofang YIN, Nanjing ZHAO, Tingting GAN, Mengyuan GU, Peilong QI, Zhichao DING, Lu WANG, Chun FENG, Xiaoling ZHANG. Relationship between Photosynthetic Fluorescence Parameters of Algae and the Initial Biomass in the Measurement of Water Quality Biological Toxicity[J]. Acta Photonica Sinica, 2022, 51(5): 0517001
    Download Citation