• Geographical Research
  • Vol. 39, Issue 9, 2015 (2020)
Lei KANG1、* and Yi LIU1、2、3
Author Affiliations
  • 1Institute of Geographic Sciences and Natural Resources Research, The Key Laboratory of Regional Sustainable Development Analysis and Simulation, CAS, Beijing 100101, China
  • 2The Guangdong-Hong Kong-Macao Greater Bay Area Institute of Strategy Research, Guangzhou 510070, China
  • 3College of Resources and Environment, University of Chinese Academy of Sciences, Beijing 100049, China
  • show less
    DOI: 10.11821/dlyj020200392 Cite this Article
    Lei KANG, Yi LIU. The key element characteristics of the optimized development and its function upgrade in the Guangdong-Hong Kong-Macao Greater Bay Area[J]. Geographical Research, 2020, 39(9): 2015 Copy Citation Text show less
    Function upgrade of key elements for optimal development of urban agglomeration
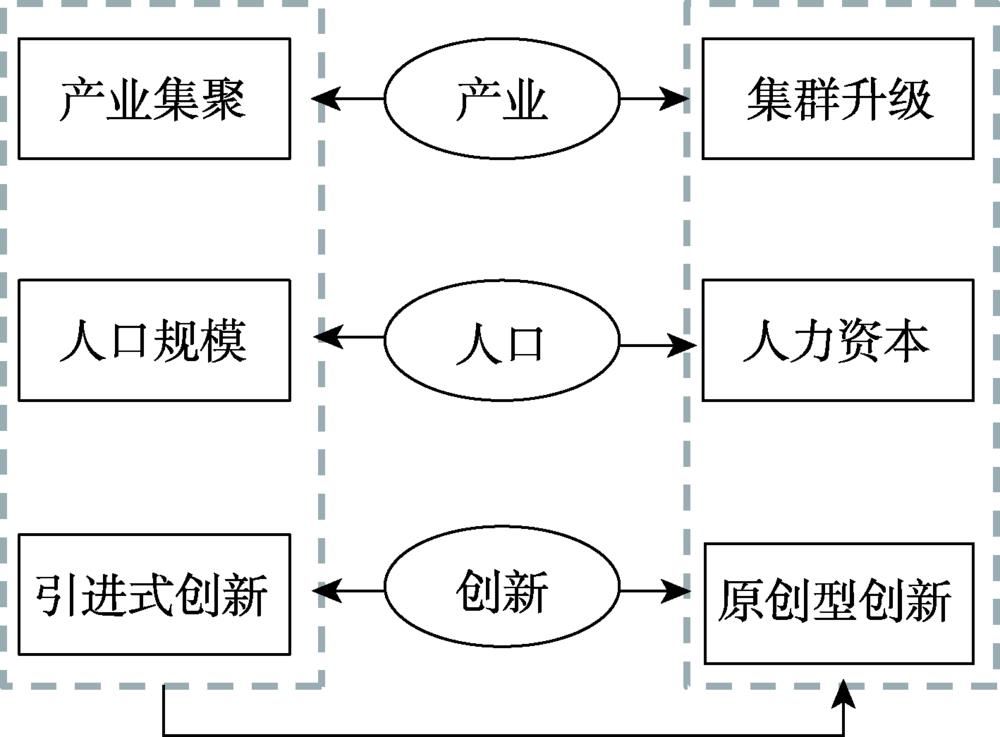
    Fig. 1. Function upgrade of key elements for optimal development of urban agglomeration
    The number of net inflows and net inflow rate of the nine cities in the Pearl River Delta in 2017
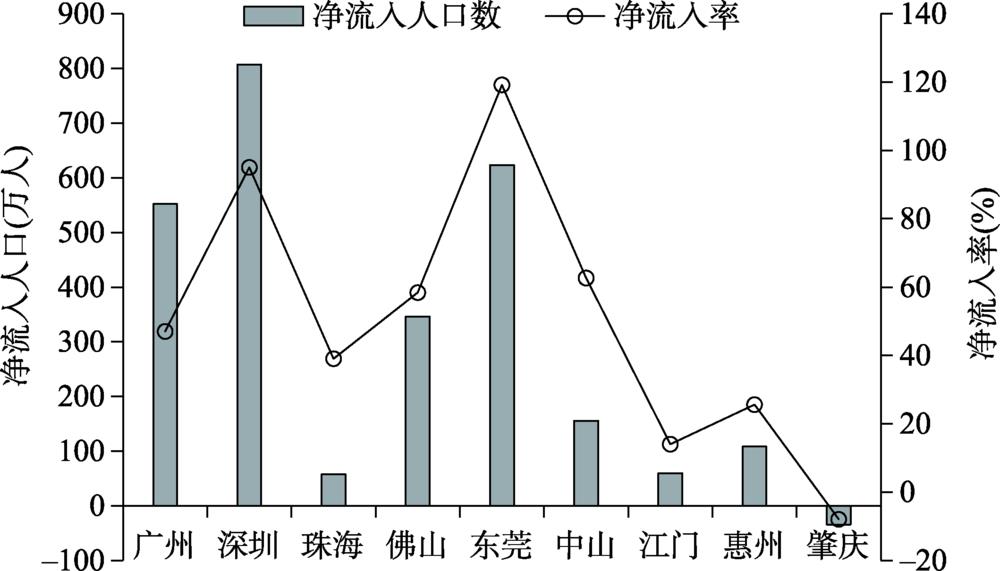
    Fig. 2. The number of net inflows and net inflow rate of the nine cities in the Pearl River Delta in 2017
    R&D expenditure intensity change trend in the Pearl River Delta from 2006 to 2018
    Fig. 3. R&D expenditure intensity change trend in the Pearl River Delta from 2006 to 2018
    Function upgrade path of key elements in the Guangdong-Hong Kong-Macao Greater Bay Area
    Fig. 4. Function upgrade path of key elements in the Guangdong-Hong Kong-Macao Greater Bay Area
    地区工业批发和零售业交通运输、仓储和邮政业住宿和餐饮业金融业房地产业信息传输、软件和信息技术服务业
    广州0.8571.1211.5150.9080.8490.7681.089
    深圳1.3120.8040.6780.7901.2140.7591.648
    珠海1.4300.7350.4460.9530.6800.6650.926
    佛山1.8790.5210.9280.3590.4050.8040.702
    东莞1.5890.8740.7520.8390.5630.7870.916
    中山1.6230.7460.5030.5100.5380.6930.887
    江门1.5730.5670.8040.6380.4710.5490.781
    惠州1.6730.7850.4871.0880.4620.7570.766
    肇庆1.1310.7450.9991.2830.3310.5470.855
    香港0.0841.5781.2541.4301.6961.8280.686
    澳门0.0450.4300.5782.7170.6070.9530.000
    粤港澳0.8881.4071.0331.2601.3671.7161.507
    Table 1. Location entropy of major industries in each city of the Guangdong-Hong Kong-Macao Greater Bay Area in 2017
    行业广州深圳珠海佛山惠州东莞中山江门肇庆
    烟酒食品加工业2.170.621.051.920.571.341.075.211.28
    纺织皮革制鞋业0.680.580.603.461.233.402.292.611.55
    造纸印刷文娱制造业0.490.990.731.950.854.751.993.121.58
    石化塑胶制造业2.761.394.194.3912.643.883.324.242.64
    矿物及金属冶炼制造业0.801.202.379.852.254.312.916.1310.38
    通用设备制造业1.280.792.392.810.511.542.041.010.67
    专用设备制造业0.321.631.071.980.221.710.680.450.61
    汽车制造业5.230.650.972.181.250.881.141.421.25
    电器机械和器材制造业0.762.197.2410.513.053.855.553.850.71
    计算机、通信和其他电子设备制造业1.6223.066.991.8115.5716.64.422.641.81
    Table 2. The proportion of the manufacturing sector’s output in GDP in the cities of the Pearl River Delta in 2018 (%)
    Lei KANG, Yi LIU. The key element characteristics of the optimized development and its function upgrade in the Guangdong-Hong Kong-Macao Greater Bay Area[J]. Geographical Research, 2020, 39(9): 2015
    Download Citation