State Key Laboratory of Advanced Optical Communication Systems and Networks, Department of Electronic Engineering, Shanghai Jiao Tong University, Shanghai 200240, China
Fan Yang, Weiwen Zou, Lei Yu, Shaofu Xu, Jianping Chen, "Impact of optical–electrical conversion responsivity in sub-sampled photonic analog-to-digital converter," Chin. Opt. Lett. 17, 040602 (2019)
Copy Citation Text
This Letter investigates the impact of the photodiode (PD) saturation in a sub-sampled photonic analog-to-digital converter (PADC) with two individual pulse lasers. It is essentially proved that when the optical power to the saturated PD increases, the optical–electrical conversion (OEC) responsivity and digitized output power of the PADC decrease. If femtosecond pulses are employed for the PADC sampling clock, the time-stretching process in a dispersive medium is necessary to decrease the impact of the PD saturation. In contrast, when the sampling clock with picosecond pulses is utilized, the PD saturation is more tolerable, and thus, the OEC responsivity can be improved by an increase of the optical power to the PD no matter if the time-stretching process is employed.
A photonic analog-to-digital converter (PADC) can overcome the limitation of an electronic analog-to-digital converter (EADC) for its higher analog bandwidth and lower timing jitter. One of the typical PADCs with high sampling rate and high resolution is named the photonic sampled and electronic digitized PADC[1,2]. In this PADC, sampling clocks generated by the mode-locked lasers (MLLs) have low timing jitters, and the modulator-based sampling gates enlarge the bandwidth of the analog input effectively[3]. The dependence of timing jitter[4], channel mismatch, modulation nonlinearity, and noise on the effective number of bits (ENOB) in a multi-channel PADC has been essentially analyzed. Moreover, the methods of multi-channel mismatch compensation[5] and high odd-order distortion suppression[6,7] have been also demonstrated.
A photodiode (PD), which serves as the key component of optical–electrical conversion (OEC) in a PADC, has been widely studied[8]. The PD gets saturated primarily because of space charge, which redistributes the electric field within the intrinsic region[9]. Due to the PD saturation, the OEC responsivity is degenerated at high optical input power. It limits the performances of high-frequency analog systems[10] as well as the PADC system[11]. Ghelfi et al. employed a dispersion compensation fiber (DCF) laid before the PD to stretch femtosecond pulses in the passively MLL (PMLL)-based PADC serving as a photonic receiver of the radar system[11]. However, the mechanism of using time stretching to enhance the OEC responsivity was not essentially presented. Moreover, an actively MLL (AMLL) with high repetition rate and large pulse width[5,12,13] was also utilized for high-sampling-rate PADC. The effect of the OEC responsivity in the AMLL-based PADC is still an unknown issue.
In this Letter, we investigate the impact of the OEC responsivity in the single-channel (sub-sampled) PADC systems. We experimentally analyze the PD saturation under femtosecond pulses injection of a PMLL and verify that the saturation effect can indeed be postponed by time stretching, thereby enhancing the OEC responsivity of a PD. On this basis, we further study the OEC responsivity in a PADC system and carry out two experiments based on different sampling clocks. In contrast, the PADC system with an AMLL with large pulse width has its advantage in suffering less influence of the PD saturation than that with a PMLL.
Sign up for Chinese Optics Letters TOC. Get the latest issue of Chinese Optics Letters delivered right to you!Sign up now
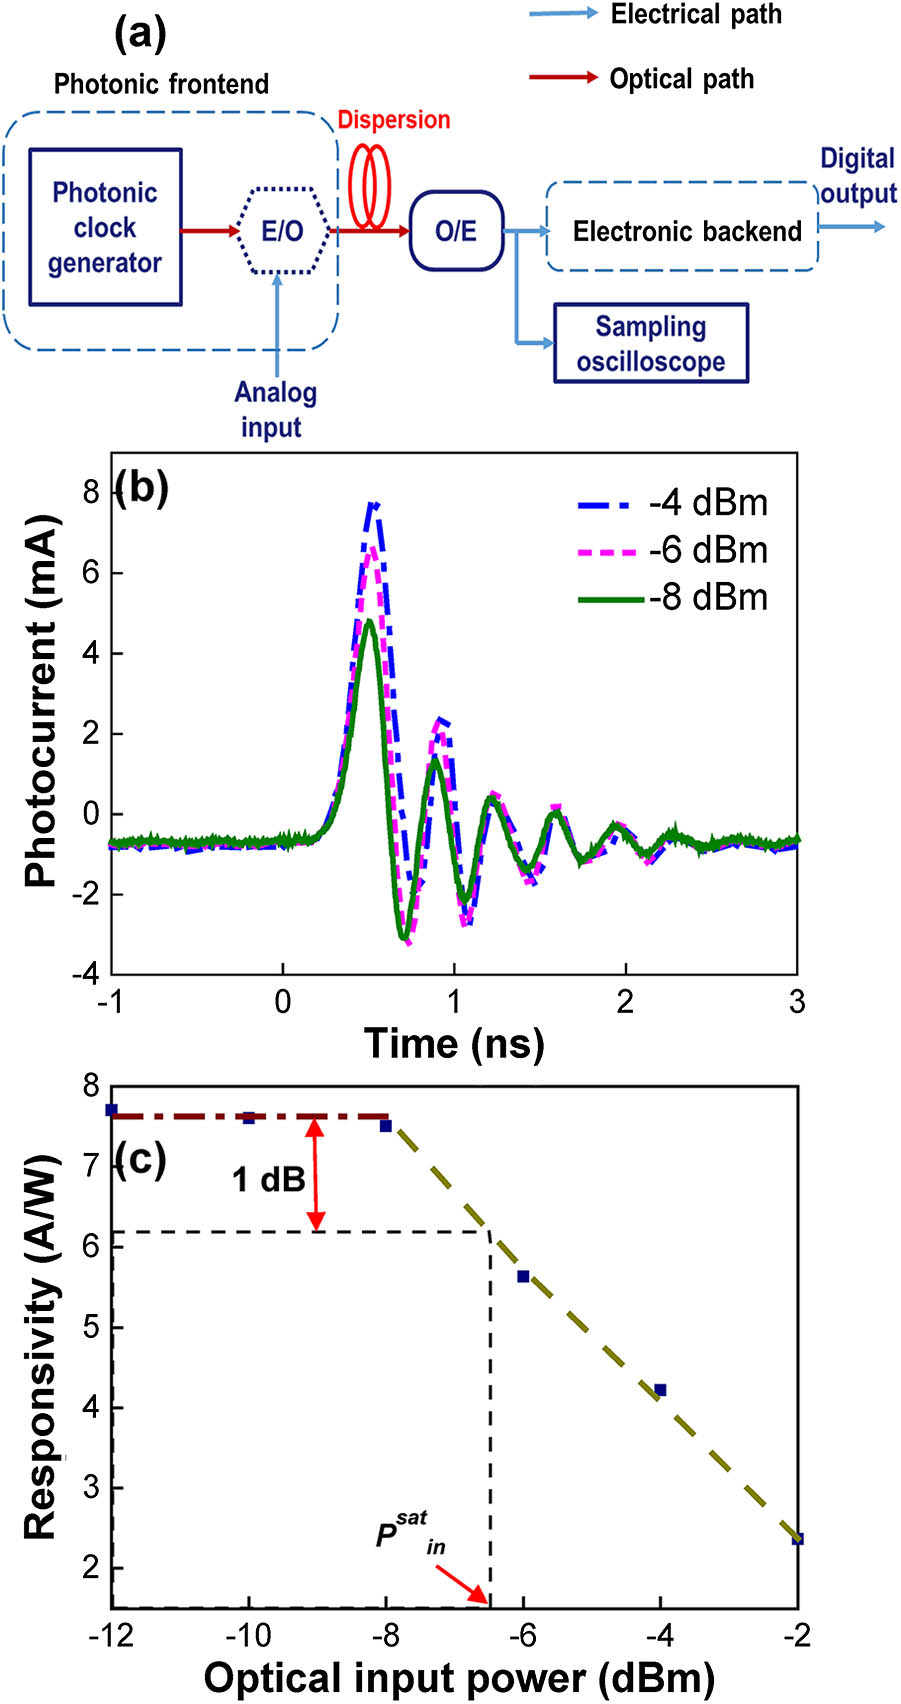
The schematic of a single-channel (sub-sampled) PADC is shown in Fig. 1(a). It consists of a photonic frontend and an electronic backend. We use a PMLL (Menlo Systems, C-Fiber) to generate the optical sampling pulses with a 100 MHz repetition rate and a 3 GHz-bandwidth PD (Beijing Conquer Ltd., ROF-005-3-15-FA-N) with 12 V bias voltage and transfer the optical sampling pulses into the electrical ones. When the optical input power to the PD is gradually increased, the output waveforms are continuously observed in a sampling oscilloscope (Keysight, DCA-X 86100D).
Figure 1.(a) Schematic of a single-channel (sub-sampled) PADC. E/O, electro-optical modulation; O/E, optical–electrical conversion; DSP, digital signal processor. (b) The output waveforms with different optical input powers. (c) The decrease of the OEC responsivity.
The OEC responsivity of a PD () is defined by where is the input average optical power to the PD, and is the effective photocurrent. The experimental results are depicted in Figs. 1(b) and 1(c). In Fig. 1(b), when the optical input power increases from to , the peak of the signal becomes saturated, while an extended tail appears as reported in Ref. [9]. According to Eq. (1), each optical input power corresponds to an . The experimental results are plotted in Fig. 1(c) by solid squares, which indicates that decreases with due to the PD saturation. As shown in Fig. 1(c), there is a 1 dB compression point of the PD saturation denoted by . is the saturation average optical power and corresponds to a saturation peak power . When the optical peak power exceeds , the saturation effect becomes more serious when the optical input power is further increased.
According to Refs. [10,14], the PD works effectively as a resistance–capacitance (RC) filter, denoted by . The cut-off frequency of is , and is inversely proportional to . Before the saturation (), the electrical pulses of the PD can be described by where is the temporal optical pulse signal, and denotes the temporal convolution.
Based on the experimental results shown in Figs. 1(b) and 1(c), we may use an experienced piecewise function to describe the PD saturation effect, where is the converted electrical pulses of the PD, is the proportional coefficient, and is an integer. The experimental results in Fig. 1(c) are least-squared fitted by Eqs. (2) and (3), which provide the coefficients as follows: , , and .
We assume that the optical sampling pulse generated by an MLL is a Gaussian-like pulse. The electric field can be described as[15]where is the pulse half-width, and is the pulse amplitude. After propagation through a dispersion fiber with the length of , the electric field can be represented by[16]where is the second derivative of the propagation constant in the fiber with respect to the angular frequency.
To analyze the relationship between the optical pulse width and OEC responsivity, both the simulation and experiment are carried out. Figures 2(a) and 2(b) show the simulated results with or without time stretching. In the simulation, , the average power of the optical pulses is 1 mW, and the dispersion is set to be 3.4 ps/nm. is calculated to be 1.22 A/W by Eq. (1). In contrast, since the time-stretched optical pulses have the same average power as the original pulses and the width turns out to be 400 fs, lower peak power does not lead to the PD saturation easily, and reaches 1.30 A/W.
Figure 2.Simulated and experimental results with or without time stretching to ultrafast optical pulses before and after photodetection. (a) and (b) are simulated temporal waveforms. (c) and (d) are experimental temporal waveforms.
In the experiment, we insert a standard single-mode fiber (SMF) with a dispersion coefficient of 17 ps/(nm·km) and a length of 0.2 km between the PMLL and PD in Fig. 1(a). The shape of optical input is measured by frequency-resolved optical gating (FROG, GRENOUILLE, Model 15-40) and plotted in Fig. 2(c). The electrical output converted by the PD is observed by the sampling oscilloscope and depicted in Fig. 2(d). When optical average power reaches 1 mW, the PD turns to saturate, and thus, the time-stretching method improves from 1.65 to 1.75 A/W. Except for the difference of the OEC responsivity between simulation and experiment that is due to the minor difference of the pulse width, the simulation and experimental results match well with each other. It proves that the experienced model [see Eqs. (2) and (3)] is effective for analyzing the reason that decreases with the increase of the optical input power. Besides, the time-stretching method can indeed postpone the OEC saturation and get a higher OEC responsivity of a PD.
We employ two experiments to investigate the impact of the OEC responsivity and the digitized output power in the single-channel (sub-sampled) PADC system. The experimental setup is illustrated in Fig. 3. We use a polarization controller (PC) to control the optical polarization of the Mach–Zehnder modulator (MZM, Photoline, MXIQ-LN-40) to optimize the electro-optical modulation, the same SMF depicted in Fig. 1(a) to stretch the optical sampling pulses, the 3 GHz PD to convert the optical pulses to electrical ones, and a variable optical attenuator (VOA) to change the optical input power to the PD. The sampling clock is achieved by the PMLL or AMLL, respectively. In Fig. 3(a), the PMLL with 100 MHz repetition rate generates 90 fs sampling pulses and samples an 11.025 GHz radio frequency (RF) signal provided by a signal generator (Keysight, N5183B) via the MZM. In Fig. 3(b), an AMLL (Calmar, PSL-10-TT) generates the sampling pulses with the 10 GHz repetition rate and 0.8 ps pulse width and samples a 27.5 GHz RF signal via the MZM. In order to keep in line with the repetition rate of the PMLL or AMLL, the electrical signal is digitized by a 100 MSamples/s EADC (Texas Instruments, ADC16DX370EVM) in Fig. 3(a), whereas a 10 GSamples/s real-time oscilloscope (Keysight, MSOS804A) serves as an EADC in Fig. 3(b).
The OEC responsivity of the PADC () system can be defined by where is the effective voltage digitized by an EADC, which is determined by the product of and the resistance of . It is noted that each optical input power corresponds to a digitized output amplitude as well as power (). is later calculated according to Eq. (6). Figure 4(a) depicts the dependences of the digitized output power and on the increase of the optical input power when the SMF is or is not used to stretch the sampling pulses generated by the PMLL, respectively. The similar results for the AMLL-based PADC system are illustrated in Fig. 4(b). In Fig. 4(a), when the average optical input power increases from to 0 dBm without time stretching, the PD turns out to be saturated for the power beyond . Consequently, the digitized output voltage as well as power does not increase, and thus, begins to decrease. After the SMF stretches the optical pulses, the peak power is reduced to be lower than . The digitized output power of the PMLL-based PADC keeps a linear growth with the optical input power, and its OEC responsivity is further improved for high input power. Compared with the PMLL, the pulses generated by the AMLL have a higher repetition rate and larger pulse width, which results in a lower peak power at the same average power and thus a larger digital output power. In Fig. 4(b), the digitized output power of the AMLL-based PADC keeps a good linear relationship with the optical input power, which is far different from that depicted in Fig. 4(a). This is because the PD does not saturate within the same input power range of 0 dBm, and thus, its OEC responsivity is not affected. It leads to the time stretching bringing no influence on the experimental results of the AMLL-based PADC.
Figure 4.Measured variations of the digitized output power and with the increase of the optical input power with or without SMF stretching in (a) PMLL-based and (b) AMLL-based PADC systems.
The signal-to-noise-and-distortion ratio (SINAD) and ENOB are two key parameters to evaluate the performance of a PADC system[13]. According to the IEEE standard for ADC systems[17], SINAD and ENOB are characterized via single-tone (sine) signal quantization. The SINAD is determined by where denotes the digitized output power, and or corresponds to the power of distortions or noise, respectively. The ENOB can be calculated by the SINAD as follows:
The distortion of a sub-sampled PADC is mainly introduced by the sampling gate of the intensity modulator[15]. In the experiment, it is carefully ensured by optimization of the bias voltage to the modulator[6,7]. Physically, the noise level could be influenced by the optical input power to the PD[8]. However, since the total loss of SMF including the insertion loss is about 0.04 dB, it is reasonable to compare the SINAD or ENOB enhancement of the sub-sampled PADC with or without a dispersive SMF under the same input power. Figure 5 shows the experimental results of the ENOB enhancement of the PADC systems before and after the adaptation of dispersive SMF. In the PMLL-based PADC system, as the average optical input power increases from to 0 dBm, it can be seen that the time-stretching method postpones the PD saturation and enhances the ENOB effectively. From Fig. 5(b), in the AMLL-based PADC system, it is more difficult to saturate the PD, and the ENO does not show a significant degeneration within the same input power range of 0 dBm as the PMLL-based PADC system. Note that the ENOB in the AMLL-based PADC system is lower than that in the PMLL-based PADC system because the adopted oscilloscope has lower quantization resolution than the 100 MSamples/s EADC.
Figure 5.Experimental results of the ENOB before and after the time-stretching process in the (a) PMLL-based and (b) AMLL-based PADC systems.
In conclusion, we have investigated the impact of the OEC responsivity in the single-channel (sub-sampled) PADC system by use of the time-stretching method to the femtosecond sampling clock of the PMLL and the picosecond sampling clock of the AMLL. The OEC responsivity and ENOB of the AMLL-based PADC system are not easily affected by PD saturation compared with that of the PMLL-based PADC system. In the PMLL-based PADC system, the time-stretching method postpones the PD saturation, and the OEC responsivity is improved. However, the PD saturation turns out to be more tolerable for the AMLL-based PADC system, and thus, the OEC responsivity keeps the linear growth with the optical input power to PD no matter whether the time-stretching method is used or not. Moreover, the dispersive fiber is short, passive, and almost lossless so that it introduces ignorable influence on the distortion and noise of the PADC systems. Thus, the ENOB is correspondingly enhanced, since the OEC responsivity is improved.