• Resources Science
  • Vol. 42, Issue 6, 1099 (2020)
Hong JU1、3, Tongsheng LI1、2、*, and Zhouyan ZHAI4
Author Affiliations
  • 1College of Urban and Environment, Northwest University, Xi’an 710127, China
  • 2Shaanxi Institute of Provincial Resource, Environment and Development, Northwest University, Xi’an 710127, China
  • 3Shandong Jianzhu University, Jinan 250101, China
  • 4College of Tourism, Henan Normal University, Xinxiang 453007, China
  • show less
    DOI: 10.18402/resci.2020.06.08 Cite this Article
    Hong JU, Tongsheng LI, Zhouyan ZHAI. Spatial-temporal differentiation of high-quality industrial development level in the Yellow River Basin based on ecological total factor productivity[J]. Resources Science, 2020, 42(6): 1099 Copy Citation Text show less
    Research scope of the Yellow River Basin
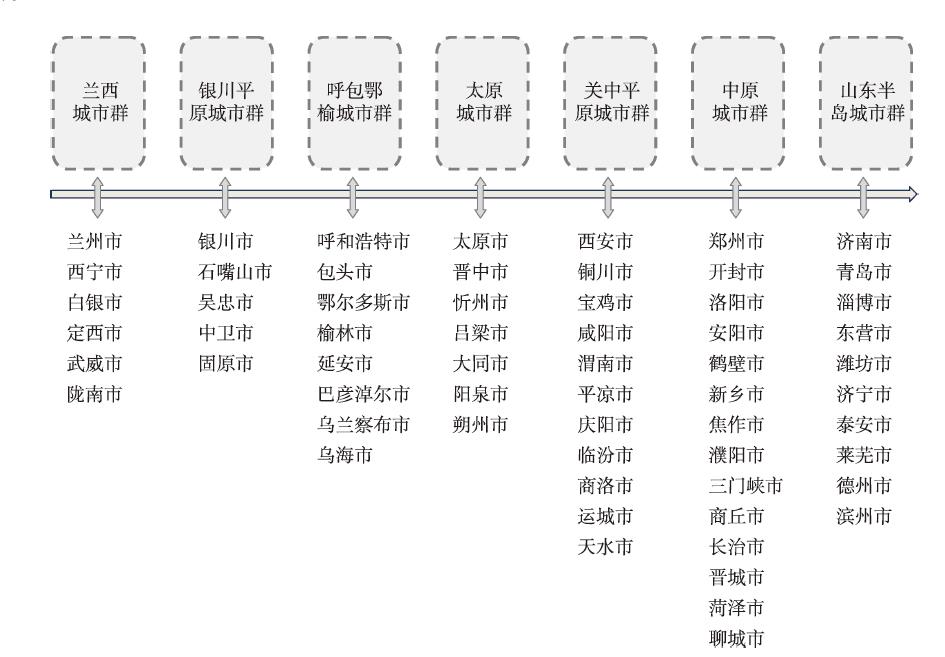
    Fig. 1. Research scope of the Yellow River Basin
    Industrial data of the Yellow River Basin, 2006-2016
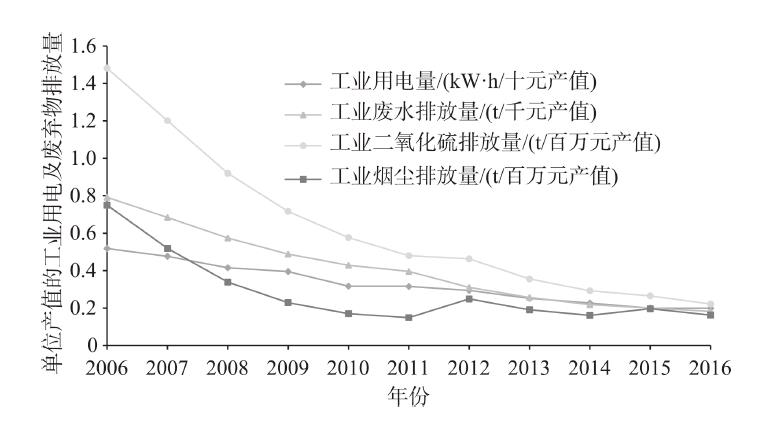
    Fig. 2. Industrial data of the Yellow River Basin, 2006-2016
    Ecological total factor productivity (ETFP) distribution in 2006 and 2016
    Fig. 3. Ecological total factor productivity (ETFP) distribution in 2006 and 2016
    200620112016
    莫兰指数0.0570.0060.177
    z-得分1.4650.5602.815
    p-值0.1430.5750.004
    Table 1. Spatial autocorrelation test results of ecological total factor productivity (ETFP) in 2006, 2011, and 2016
    年度ECTCPTECSECETFPCTFPC
    2006—20071.0631.0461.0171.0451.1131.088
    2007—20081.0211.1271.0330.9891.1511.157
    2008—20091.0061.1461.0011.0051.1531.112
    2009—20100.9911.0110.9960.9951.0020.965
    2010—20111.0041.1450.9771.0271.1501.113
    2011—20120.9441.0921.0060.9381.0311.103
    2012—20131.0121.1251.0180.9941.1391.051
    2013—20140.9511.0850.9690.9811.0310.960
    2014—20150.9521.0170.9600.9920.9680.990
    2015—20160.9671.0691.0130.9551.0340.978
    均值0.9911.0850.9990.9921.0751.049
    Table 2. Data envelopment analysis DEA-M index of industrial ecological total factor productivity (ETFP) in the Yellow River Basin
    城市群ECTCPTECSECETFPC
    兰西城市群0.9971.1321.0000.9971.129
    银川平原城市群1.0061.0951.0001.0061.102
    呼包鄂榆城市群0.9821.1080.9990.9831.088
    太原城市群0.9691.1230.9720.9971.088
    关中平原城市群1.0321.0991.0001.0321.134
    中原城市群1.0051.0571.0031.0021.062
    山东半岛城市群1.0001.0691.0001.0001.069
    Table 3. Data envelopment analysis (DEA)-M index of industrial ecological total factor productivity (ETFP) of urban agglomerations, 2006-2016
    单元名称ETFPC单元名称ETFPC单元名称ETFPC单元名称ETFPC
    兰西城市群鄂尔多斯市1.083咸阳市1.142安阳市1.056
    定西市1.175包头市1.077宝鸡市1.112焦作市1.051
    白银市1.130呼和浩特市1.039运城市1.084晋城市1.022
    武威市1.089延安市0.997西安市1.072开封市1.014
    西宁市1.078榆林市0.968平凉市1.044长治市1.012
    兰州市1.065太原城市群天水市1.041鹤壁市0.984
    陇南市0.960阳泉市1.133庆阳市1.000山东半岛城市群
    银川平原城市群忻州市1.063临汾市0.998东营市1.203
    中卫市1.198太原市1.054中原城市群济宁市1.152
    石嘴山市1.102吕梁市1.037三门峡市1.132泰安市1.144
    吴忠市1.056大同市1.015菏泽市1.119德州市1.132
    银川市1.034朔州市1.003聊城市1.112青岛市1.116
    固原市1.013晋中市0.991濮阳市1.098潍坊市1.088
    呼包鄂榆城市群关中平原城市群商丘市1.083滨州市1.069
    乌海市1.172商洛市1.189洛阳市1.082淄博市1.057
    巴彦淖尔市1.095渭南市1.163新乡市1.082莱芜市1.052
    乌兰察布市1.085铜川市1.162郑州市1.058济南市1.039
    Table 4. Data envelopment analysis (DEA)-M index of industrial ecological total factor productivity (ETFP) of cities in the Yellow River Basin, 2006-2016
    Hong JU, Tongsheng LI, Zhouyan ZHAI. Spatial-temporal differentiation of high-quality industrial development level in the Yellow River Basin based on ecological total factor productivity[J]. Resources Science, 2020, 42(6): 1099
    Download Citation