Abstract
Based on air temperature observation data from 32 meteorological stations, temperature changes in the middle Qinling Mountains from 1959 to 2016 were analysed with respect to the north-south, seasonal and altitude differences. Our research mainly showed the following results. The annual temperature (TA) rose approximately 0.26℃/10a within the past 58 years. This warming trend was stronger on the northern slope than on the southern slope, and a warming trend reversal occurred in 1994 on the northern slope, which was three years earlier than on the southern slope. The temperature changes for the four seasons were not synchronized, and the trend in spring contributed the most to the TA trend, followed by winter, autumn, and summer. The temperature difference between summer and winter (TDSW) decreased significantly over the past 58 years. The temperature change in the middle Qinling Mountains was clearly dependent on altitude. With increases in altitude, the TA increased gradually and became stronger while the TDSW decreased gradually and became weaker. Differences in temperature change between the north and south were mainly observed in low-altitude areas. With increase in altitude, the differences gradually tended to disappear.1 Introduction
Much attention has been paid to the effects of global climate change. The IPCC’s fifth assessment reported that the average temperature from 2003 to 2012 was 0.78℃ higher than that from 1950 to 1900 (IPCC, 2013). The response to global warming in mountains is more sensitive than in other geomorphological types at the same latitude. Therefore, mountain climate change has become an important topic in global change research (Beniston et al., 2009; Pederson G T et al., 2010). Many studies have shown that the rate of warming increases in the mountains as the altitude increases (Pepin, 2015). There are significant differences in annual mean temperature, annual maximum and minimum temperature, seasonal temperature, and diurnal temperature between high-altitude mountains and low-altitude areas (Barry, 2001; Seidel and Free, 2003; Qin et al., 2013; Ma et al., 2019).
In the 20th century, the rate of climate warming in the European Alps was higher than the global average and the Northern Hemisphere average. As a rule, the increase in low temperatures was greater than that of high temperatures, with the trend of temperature change showing an imbalance between day and night (Beniston et al., 1994; Ceppi et al., 2012). From 1959 to 2008, the temperature trend in the Alps was higher in summer (0.46℃/10a) than winter (0.40℃/10a) (Seidel and Free, 2003). On the Qinghai-Tibet Plateau, which is called the “Roof of the World”, the rate of temperature increase demonstrated a significant seasonal change, and the rate of temperature increase during winter was approximately twice that of the annual average increase (Niu et al., 2004; Chen et al., 2006). A significant vertical difference occurs in the rate of increase in minimum temperatures on the Qinghai-Tibet Plateau, especially in winter and spring (Liu et al., 2009; Rangwala et al., 2010). In the Himalayas, which are in India and Nepal, the increase in high temperatures was greater than in low temperatures, and the high dependence of the rate of high temperature increase was very prominent. As the altitude of mountains increased, the rate of high temperature gradually increased (Shrestha et al., 1997; Bhutiyani et al., 2007).
The Qinling Mountains, which stretch from east to west across the central part of China, are one of the key areas of global biodiversity and an important north-south boundary in China (Kang and Zhu, 2007), and they are also a transitional zone and sensitive zone to climate change (Li et al., 2018). From the perspective of climate change, China's warming rate is higher than the global average, and there are obvious differences between different regions (CMA, 2018). Our research shows that the temperature of the Qinling Mountains has risen rapidly after 1993 (Zhou et al., 2011). The degree of temperature rise in the western Qinling Mountains was stronger than that in the eastern Qinling Mountains (Wang, 2003). At the same time, the drought frequency in the western Qinling Mountains was also higher than that in the eastern Qinling Mountains, and the rising temperature was a major contributor to the increased drought frequency (Qi et al., 2019). As the Qinling Mountains have a special topography and geographical location, temperature changes in the Qinling Mountains (to some extent) represent the early signs of climate change in China and of differences between northern and southern China. Is the temperature change consistent between the northern and southern slopes? Are seasonal temperature changes synchronized? Does temperature change depend on altitude? With these questions in mind, we used the mountain ridge line as the north-south boundary and analysed temperature data from 32 meteorological stations in the middle Qinling Mountains from 1959 to 2016 to reveal the spatial and temporal variations in the average annual temperature (TA), the seasonal temperatures, and the temperature differences between winter and summer (TDSW) of the northern and southern slopes of the middle Qinling Mountains. Furthermore, we discussed the altitude gradient effect of the temperature changes on the middle Qinling Mountains to provide a basis for the study of regional mountain climate change.
2 Study area
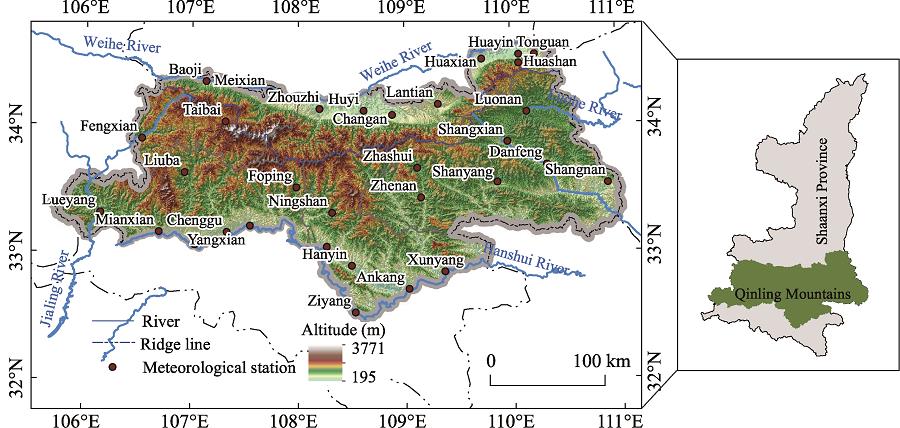
This article takes the section of the Qinling Mountains in Shaanxi Province (middle Qinling Mountains) as the study area (105°30′-110°05′E and 32°40′-34°35′N). This area starts from the Jialing River in the west and is connected to the Funiu Mountains on the east, with the Weihe River as the boundary to the north and the Hanshui River as the boundary to the south. The altitude of the study area is approximately 195-3771.2 m. The northern slope is steep, and the southern slope extends gradually (Figure 1). Influenced by the topography, the study area has a complex climatic environment and presents diverse climatic resources. Because the large mountain system blocks the warm and wet air from the southeast of the East Asian monsoon and the dry and cold air from the northwest (Weng and Luo, 1990), the northern part of the study area is dry and belongs to a warm temperate sub-humid climate, while the southern part of it is warm, moist, and rainy and belongs to a subtropical humid climate. The middle Qinling Mountains have distinct seasons and are both rainy and hot during the same period. The average TA is approximately 10.7℃, the average temperatures of the four seasons are approximately 11.1℃, 20.7℃, 10.8℃, and 0.14℃, and the TDSW is approximately 20.6℃. The spatial distributions of the TA and TDSW are shown in Figure 2. The annual precipitation is approximately 600-1200 mm, and distinct spatial variation occurs in the temperature and precipitation patterns (Ma, 2015).

Figure 1.
Location of the middle Qinling Mountains, China
Figure 2.
Spatial distribution of annual temperature and temperature difference between summer and winter of the middle Qinling Mountains3 Data and methods
3.1 Data sources
The daily average temperature data used for this study were collected from 32 national meteorological stations in the study area covering a period of 1959 to 2016 and obtained from the Shaanxi Meteorological Bureau. The DEM is obtained from National Geomatics Centre of China, and its spatial resolution is 25 metres.
3.2 Acquiring the spatial temperature datasets
The Thin Plate Smoothing Spline interpolation method, which is built into ANUSPLIN software, uses a smooth parameter balance to optimize the smoothness of the fitting surface and data fidelity and is suitable for complex mountainous areas because the root-mean- square error and other statistical indicators can evaluate the high interpolation accuracy of the method (Xu et al., 2018; Lu et al., 2019). In this paper, the DEM was used as a covariable and the TPS method was used to convert the station temperature data into plane domain data for generating raster data of the TA, the seasonal average temperature, and the TDSW for the years from 1959 to 2016. Among them, the TDSW was obtained by subtracting the winter temperature from the summer temperature. To verify the accuracy of spatially interpolated data, observation data were collected from 11 automated regional meteorological stations on Mt. Taibai, the main peak of the middle Qinling Mountains, from 2013 to 2016, and these data were used to verify the interpolation results. Table 1 shows the geographical information of the 11 meteorological stations on Mt. Taibai. Upon examination, the annual and seasonal temperature space interpolation error was within ±1.0℃, which shows that the interpolation results have high reliability and can be used to analyse the variation characteristics of temperature in the middle Qinling Mountains.
| Location | Station name | Latitude (°N) | Longitude (°E) | Altitude (m) |
|---|
| North slope | Tangyu1 | 34.004 | 107.815 | 3213 |
| Tangyu2 | 34.000 | 107.816 | 2767 |
| Tangyu3 | 34.013 | 107.833 | 2253 |
| Jiangmeigonglu | 34.067 | 107.467 | 1510 |
| Honghegu | 34.004 | 107.755 | 1273 |
| Yingge | 34.083 | 107.683 | 857 |
| Wengongmiao | 33.998 | 107.811 | 3378 |
| South slope | Taiyanggonglu | 33.884 | 107.409 | 2329 |
| Taiyanggonglubei | 33.969 | 107.299 | 2000 |
| Taiyanggonglunan | 33.872 | 107.455 | 1988 |
| Huangbaiyuan | 33.817 | 107.517 | 1232 |
Table 1.
Regional meteorological stations on Mt. Taibai, Shaanxi Province
3.3 Analysis of temperature variation trends
A linear trend analysis was used to analyse the spatial variation trend of air temperature. The least square method was used to fit the temperature trend by pixel (Deng et al., 2018), and the formula is as follows.
${{\theta }_{slope}}=\frac{n\times \mathop{\sum }_{i=1}^{n}i\times {{T}_{i~}}-\mathop{\sum }_{i=1}^{n}i\mathop{\sum }_{i=1}^{n}~{{T}_{i}}}{n\times \mathop{\sum }_{i=1}^{n}{{i}^{2}}-{{\left( \mathop{\sum }_{i=1}^{n}i \right)}^{2}}}$
where i is the annual serial number from 1 to 58, Ti is the temperature in year i, and qslope is the change slope. When qslope is greater than 0, then the temperature of the pixel shows an increasing trend over the past 58 years; and when qslope is less than 0, then the temperature of the pixel shows a decreasing trend over the past 58 years.
The Mann-Kendall method was used to test the abrupt change in and significance of the temperature trend over the time series. The M-K test is a non-parametric test recommended by the World Meteorological Organization and is widely used. This method can test the significance of the change trend of a time series as well as the mutation test (Wang et al., 2017). The basis of this test is to provide the statistic “U” and provide the level of significance “a”. For a=0.05 and Ua/2=1.96, if |U|> Ua/2, then there is a significant trend; if U is negative, then there is a downward trend; and if U is positive, then there is an upward trend.
4 Results
4.1 Spatiotemporal variation trends of annual temperature
Figures 3a and 3b show the time regulation of the TA variation trend for the northern and southern slopes of the middle Qinling Mountains from 1959 to 2016. Figure 3a shows the results of the M-K test and indicates that the TA of the northern and southern slopes showed an upward trend from 1959 to 2016, and obvious mutation time points were observed for the TA change. Both the rate and the direction of the temperature increase changed before and after the mutation of the TA. On the southern slope of the middle Qinling Mountains, the TA showed no significant decline from 1959 to 1997 and began to show gradually rising temperatures after 1997, with the warming rate reaching significance by 2001. The TA increased from 10.4℃ to 11.2℃ before and after the mutations. On the southern slope of the middle Qinling Mountains, the TA showed no significant decline from 1959 to 1994 and began to show gradually rising temperatures beginning in 1994, with the warming rate reaching significance in 1999. The TA increased from 9.6℃ to 10.5℃ before and after the mutations. The temperature increase was approximately twice as large as that for the southern slope.
Figure 3.
Time and space of TA variation trend in the middle Qingling Mountains from 1959 to 2016Figure 3c shows the spatial distribution of the TA changes on the middle Qinling Mountains and indicates that the TA variation trend from 1959 to 2016 was 0.25℃/10a. The temperature change rate was greater on the northern slope than on the southern slope, with values of 0.29℃/10a and 0.25℃/10a, respectively. The TA rose in the entire area of the northern slope, and no area showed a downward trend. The area with a temperature rise rate of 0.20-0.30℃/10a was the largest in all of the northern slope, accounting for 47.81%. The TA of the southern slope of the middle Qinling Mountains was still mainly increasing, although 0.06% of the regional temperature shows a downward trend. The TA rate of increase was 0.20-0.30℃/10a, which accounted for 39.28% of the south slope.
4.2 Seasonal changes in temperature
4.2.1 Asynchrony of temperature change across the four seasons
Figure 4 shows the temperature variation trend across the four seasons in the middle Qinling Mountains from 1959 to 2016. The temperature in spring, autumn and winter exhibited a significant upward trend for almost the entire region, although summer was the exception. The season showing the strongest temperature increase was spring, followed by winter and autumn. Temperatures during spring had an extremely significant increasing trend over the entire area, and the average rate was 0.33℃/10a. The temperature change rate for winter was 0.30℃/10a, and the extremely significant warmer area accounted for 88.51% of the middle Qinling Mountains. The temperature change rate for autumn was 0.27℃/10a, and the extremely significant warmer area accounted for 68.21% of the study area. The temperature change rate for summer was smaller than that for the other seasons at approximately 0.08℃/10a, and obvious regional differences were observed. The temperature showing an upward trend occupied over 75.07% of the region in summer. The area showing significantly increased temperatures accounted for approximately 22.23% of the study area and was mainly distributed on Mt. Taibai and in Zhashui and Zhenan counties. The areas of temperature decrease accounted for 24.93% of the study area in summer, and the areas of significantly decreased temperatures accounted for 1.60% of the study area, and they were mainly distributed in the southernmost part of Ankang city and the easternmost part of Shangluo city.
Figure 4.
Variation trend of the temperature across the four seasons in the middle Qinling Mountains from 1959 to 2016In addition to the TA change trend, there was also a north-south variation in the temperature among the four seasons. Figure 5 shows that the rate of temperature change on the northern slope was greater than that on the southern slope for the four seasons. The difference in the temperature trend between the northern and southern slopes was the greatest in spring, with a difference of 0.09℃/10a. The largest contribution to the TA trend was the spring temperature trend, with 35.60% on the northern slope and 32.31% on the southern slope, and a lower contribution was observed in winter. The contribution rate of the summer temperature trend to the average annual temperature was the smallest.
Figure 5.
Contribution of four seasons to the TA trend in the middle Qinling Mountains from 1959 to 20164.2.2 Temperature difference between summer and winter showed a decreasing trend
The TDSW also changed noticeably with an unsynchronized change in temperature across the four seasons. Figure 6 shows the TDSW variation trend of the northern and southern slopes on the middle Qinling Mountains from 1959 to 2016. Figure 6a shows the M-K test results and indicates that the TDSW of the northern and southern slopes both showed a decreasing trend in the past 58 years, and there were obvious mutation time points of the TDSW variation trend. These mutation time points occurred in 1976 on the northern and southern slopes, and the TDSW occurred significantly earlier than the time of the TA. The TDSW decreased rapidly from 1976 onward and significantly decreased in 1981 on the northern slope, while a similar decrease took place in 1982 on the southern slope. The decreasing trend of the TDSW gradually slowed after 1990. The TDSW decreased from 21.6℃ to 20.5℃ on the southern slope and from 22.8℃ to 21.3℃ on the northern slope before and after the mutations, respectively.
Figure 6.
Spatiotemporal variations of TDSW trend in the middle Qinling Mountains from 1959 to 2016Figure 6c shows the spatial distribution of the TDSW for the most recent 58 years in the middle Qinling Mountains. The trend of the TDSW was -0.23℃/10a, with a trend of -0.25℃/10a on the northern slope and -0.22℃/10a on the southern slope. The decreased trend of the TDSW indicates a spatial distribution of “larger centre and smaller periphery” and “larger eastern and smaller western”. The decrease in the TDSW leads to a decrease in “natural cold energy”, which affects vegetation growth and the growing season for crops in the middle Qinling Mountains.
4.3 Altitude-dependent temperature variation in the middle Qinling Mountains
4.3.1 TA and TDSW change with elevation
Figure 7 shows the change rate of the TA and TDSW when the altitude increases by 100 m. This figure shows that both the TA and TDSW change rates were significantly correlated with altitude.The TA trend increased with increasing altitude. The TA heating rate increased by 0.014℃/10a and 0.012℃/10a for each 100 m increase in altitude on the southern slope and the northern slope, respectively. In areas of low altitude, the TA trend was small and there was a significant difference in this trend between the northern and southern slopes. The TA trend was larger on the northern slope than on the southern slope. As the altitude increased, the difference between the northern and southern slopes gradually decreased. The TA trend presented almost no change at an altitude of 2600 m or more on the northern and southern slopes, and a warming trend of more than 0.50℃/10a occurred.
Figure 7.
Variation trend of the annual temperature and the TDSW change with altitude in the middle Qinling Mountains from 1959 to 2016The TDSW trend weakened with an increase in altitude. The TDSW rate of decrease was reduced by 0.008℃/10a per 100 m and 0.009℃/10a per 100 m of increased altitude on the southern slope and northern slope, respectively. In areas of low altitude, the TDSW showed a significant decreasing trend and a significant difference occurred between the north and south, with a stronger descending trend observed for the northern slope than the southern slope. As the altitude increased, the difference in the TDSW trend between the northern and southern slopes gradually decreased, and the decrease in the TDSW trend gradually approached 0℃/10a at altitudes above 3000 m.
4.3.2 Seasonal temperature trend at different altitudes
According to the outline of ecological and environmental protection of the middle Qinling Mountains in Shaanxi Province and considering the obvious influence of human activities on air temperature in low-altitude areas, the middle Qinling Mountains are divided into four categories according to the altitude. The trend of temperature across four seasons in different vertical belts is analysed as shown in Table 2. The table showed that with an increase in altitude, the temperature trend increased gradually in each vertical belt across the four seasons. In the areas with altitudes lower than 600 m, the temperature trend during summer was not significant. However, the temperature trend for the other three seasons all showed increase, with the largest temperature trend observed for spring on the northern slope (up to 0.40℃/10a). For areas above 2600 m, the temperature trends for each season’s rate were greater than that for the other vertical belts, and the temperature tendency for autumn was the greatest in high-altitude areas, which was 0.57℃/10a and 0.59℃/10a on the southern and northern slopes, respectively. Therefore, the response to climatic warming of high-altitude areas was more obvious in the middle Qinling Mountains.
| Altitude ranges (m) | Spring | Summer | Autumn | Winter |
|---|
| N | S | N | S | N | S | N | S |
|---|
| <600 | 0.40** | 0.25** | -0.05 | -0.08 | 0.18** | 0.15* | 0.27** | 0.18** |
| 600-1500 | 0.39** | 0.30** | 0.05 | 0.05 | 0.27** | 0.24** | 0.32** | 0.28** |
| 1500-2600 | 0.41** | 0.34** | 0.24* | 0.23* | 0.42** | 0.39** | 0.42** | 0.40** |
| >2600 | 0.42** | 0.39** | 0.45** | 0.43** | 0.59** | 0.57** | 0.52** | 0.50** |
Table 2.
Temperature trend of different vertical belts in four seasons of the middle Qinling Mountains during 1959 to 2016 (℃/10a)
5 Discussion and conclusions
5.1 Conclusions
Based on our research on temperature changes from different spatial and temporal scales from 1959 to 2016, we found that the middle Qinling Mountains showed a warming trend and that the trend of TA was 0.26℃/10a. Due to the specific topography and geographical location of the middle Qinling Mountains, there was a north-south difference in temperature change. The warming trend of the northern slope was greater than that of the southern slope, with values of 0.29℃/10a and 0.25℃/10a, respectively. The abrupt change in temperature on the northern slope took place earlier than on the northern slope, which occurred in 1994 and 1997, respectively.
Temperature changes for the four seasons were not synchronized in the middle Qinling Mountains and occurred in the order of spring (0.33℃/10a) > winter (0.30℃/10a) > autumn (0.27℃/10a) > summer (0.08℃/10a). Temperature changes in spring had the greatest contribution to the trend of the TA and reached 35.60% on the northern slope and 32.31% on the southern slope. The TDSW showed a significantly decreasing trend at a rate of -0.23℃/10a. Both the northern and the southern slopes exhibited a synchronous mutation in 1976.
Altitude dependence is observed in the trend of temperature change. At a higher altitude, the TA increased to a greater degree and the TDSW decreased at a lower rate. In low-altitude areas, the temperature on the northern slope increased significantly in spring, while in areas of high altitude, the temperature increased significantly in every season. The difference between the north and the south mainly occurred in low-altitude areas, and this difference gradually decreased with altitude.
5.2 Discussion
Mountainous areas are sensitive to climate change, and the middle Qinling Mountains represent the north-south boundary for China’s climate, geographical resources, and environment. Therefore, the difference in climate change between the southern slope and the northern slope of the middle Qinling Mountains also represents climate change characteristics for both the south and the north of China. Under the background of global warming, the temperature of the middle Qinling Mountains increased significantly, the warming trend of the northern slope was stronger than that of the southern slope, and the warming mutation of the northern slope occurred before that of the southern slope. At the same time, the temperature change trend of the four seasons was not synchronized, and the trend of the temperature increase in spring and winter was significantly higher than that in summer. Why do we observe north-south and seasonal differences? Studies have noted that temperature changes are affected by human activities, solar radiation, atmospheric aerosols, ENSO and other factors (Su et al., 2016). Mountains are complex geographical units, and the driving mechanisms underlying temperature variations between the northern and southern slopes of the middle Qinling Mountains as well as seasonal differences require further study.
First, the formation of the climate in the middle Qinling Mountains is closely related to two circulation systems. In the south of the middle Qinling Mountains, climate was mainly affected by the East Asian monsoon system and controlled by westerlies in the north (Liu, 2016). After the 1980s, due to changes in atmospheric circulation that affected the middle Qinling Mountains (mainly manifested by the strengthening of the high pressure in the western Pacific), the cold air in the polar and high-latitude regions of the Northern Hemisphere presents a weakened influence on most parts of China (Dong et al., 2015). This phenomenon promoted the temperature rise in winter and spring in the middle Qinling Mountains to some extent, especially on the northern slope. Moreover, over the past 30 years, under the warming of the Qinghai-Tibet Plateau, the high pressure in South Asia has become stronger, the frequency of the summer monsoon in East Asia has increased, and the precipitation in the Huaihe River region has increased (Cheng et al., 2013). This wet feedback may be one reason why temperatures are rising more slowly in summer than in other seasons.
Second, the middle Qinling Mountains represent a typical forest ecosystem, with lush vegetation in summer and autumn, declining vegetation in winter and spring, and greater vegetation coverage on the southern slope than on the northern slope (Bai, 2014). The vegetation coverage law and temperature trend rates were opposite, which suggests that vegetation may have a negative regulating effect on the temperature change in the middle Qinling Mountains.
Third, the northern slope of the middle Qinling is near the provincial capital Xi’an. The urban heat island has a certain effect on local microclimates. The warming trend of the middle Qinling Mountains increased with elevation, but the temperature trend of the northern slope (< 600 m) in spring is an exception, which is greater than that of the region at 600-1500 m. Thus, the urban heat island has an obvious effect on climate change.
In addition, the dependence of climate change on altitude is the focus of many scholars (Pepin et al., 2015), and temperature changes in the middle Qinling Mountains also clearly show altitude dependence. The meteorological stations we used for spatial interpolation in this paper are mostly located at middle and low altitudes, and the high-altitude meteorological stations, which were used to verify the accuracy of the spatial interpolations, only have a data duration of four years. Therefore, with the gradual accumulation of high-altitude meteorological data, the mechanism of climate change in high altitudes could be more precisely explored and better understood.
References
[1] Y Bai H. The Response of Forest Vegetation to Environment Changes in Qin-Ba Mountain., 100-118(2014).
[2] G Barry R. Mountain climate change and cryosphere response: A review. World Mountain Symposium.(2001).
[3] M Beniston, F Diaz H, S Bradley R. Climatic change at high elevation sites: An overview. Climatic Change, 36, 233-251(1997).
[4] M Beniston, M Rebetez, F Giorgi et al. An analysis of regional climate change in Switzerland. Theoretical & Applied Climatology, 49, 135-159(1994).
[5] R Bhutiyani M, S Kale V, J Pawar N. Long-term trends in maximum, minimum and mean annual air temperatures across the Northwestern Himalaya during the twentieth century. Climatic Change, 85, 159-177(2007).
[6] P Ceppi, C Scherrer S, M Fischer A et al. Revisiting Swiss temperature trends 1959-2008. International Journal of Climatology, 32, 203-213(2012).
[7] B Chen S, F Liu Y, Thomas Axel. Climatic change on the Tibetan Plateau: Potential evapotranspiration trends from 1961-2000. Climatic Change, 76, 291-319(2006).
[8] L Cheng, W Liu H, J Zhou T et al. Interdecadal variations of summer southeast and southwest monsoon frequency over East Asia and its relationship with snow cover over the Tibetan Plateau for recent 30 years. Chinese Journal of Atmospheric Sciences, 37, 1326-1336(2013).
[9] Blue Book on Climate Change in China (2018)(2018).
[10] L Dong L, Q Li Q, H Ding Y et al. Spatial and temporal characteristics of air temperature over China in spring under the background of global warming. Meteorological Monthly, 1177-1189(2015).
[11] Stockholm: IPCC, 9(2013).
[12] Y Kang M, Y Zhu. Discussion and analysis on the geo-ecological boundary in Qinling Range. Acta Ecologica Sinica, 27, 2774-2784(2007).
[13] S Li S, F Kong, J Wang. Spatiotemporal variability of temperature in northern and southern Qinling Mountains and its influence on climatic boundary. Acta Geographica Sinica, 73, 13-24(2018).
[14] C Liu. Climate change and its difference between southern and northern Qinling in Shaanxi province. Lanzhou: Lanzhou University(2016).
[15] D Liu X, G Cheng Z, B Yan L et al. Elevation dependency of recent and future minimum surface air temperature trends in the Tibetan Plateau and its surroundings. Global & Planetary Change, 68, 164-174(2009).
[16] Z Lu F, Y Lu H. A high-resolution grid database of air temperature and precipitation for Qinling-Daba Mountains in central China and its implications for regional climate. Acta Geographica Sinica, 74, 875-888(2019).
[17] Long Ma, Y Li H, X Liu T et al. Abrupt temperature change and a warming hiatus from 1951 to 2014 in Inner Mongolia, China. Journal of Arid Land, 11, 192-207(2019).
[18] P Ma X. The forest line and its response to climate change in Qinling. Xi’an: Northwest University(2015).
[19] T Niu, L Chen, Z Zhou. The characteristics of climate change over the Tibetan Plateau in the last 40 years and the detection of climatic jumps. Advances in Atmospheric Sciences, 21, 193-203(2004).
[20] T Pederson G, J Graumlich L, B Fagre D et al. A century of climate and ecosystem change in Western Montana: What do temperature trends portend. Climatic Change, 98, 133-154(2010).
[21] N Pepin, S Bradley R, F Dian H et al. Elevation-dependent warming in mountain regions of the world. Nature Climate Change, 424-430(2015).
[22] Z Qi G, Y Bai H, Q Meng et al. Climate change in the Qinling Mountains in spring during 1959-2018. Arid Zone Research, 36, 1079-1091(2019).
[23] X Qin, G Yang X, Jian LI et al. Analyses on distribution and vertical gradient of air temperature on the north slope of Mt. Qomolangma. Plateau Meteorology, 32, 1-8(2013).
[24] I Rangwala, R Miller J, L Russell G et al. Using a global climate model to evaluate the influences of water vapor, snow cover and atmospheric aerosol on warming in the Tibetan Plateau during the twenty-first century. Climate Dynamics, 34, 859-872(2010).
[25] J Seidel D, M Free. Comparison of lower-tropospheric temperature climatologies and trends at low and high elevation radiosonde sites. Climatic Change, 59, 53-74(2003).
[26] B Shrestha A, P Wake C, A Mayewski P et al. Maximum temperature trends in the Himalaya and its vicinity: An analysis based on temperature records from Nepal for the period 1971-94. Journal of Climate, 12, 2775(1999).
[27] Z Su J, M Wen, H Ding Y et al. Hiatus of global warming: A review. Chinese Journal of Atmospheric Sciences, 40, 1143-1153(2016).
[28] M Weng Z, X Luo Z. Mountain Topography and Climate., 1-129(1990).
[29] Q Zhou, J Bian J, Y Zheng J. Variation of air temperature and thermal resources in the northern and southern regions of the Qinling Mountains from 1951 to 2009. Acta Geographica Sinica, 66, 1211-1218(2011).