
Dingguo MA, Xiongzu DAI, Jinfeng YANG, Chuansheng WANG. Resource and environmental carrying capacity and optimal population size for village and town development: Taking Yongfeng County of Jiangxi Province as an example [J]. Resources Science, 2020, 42(7): 1249
- Resources Science
- Vol. 42, Issue 7, 1249 (2020)
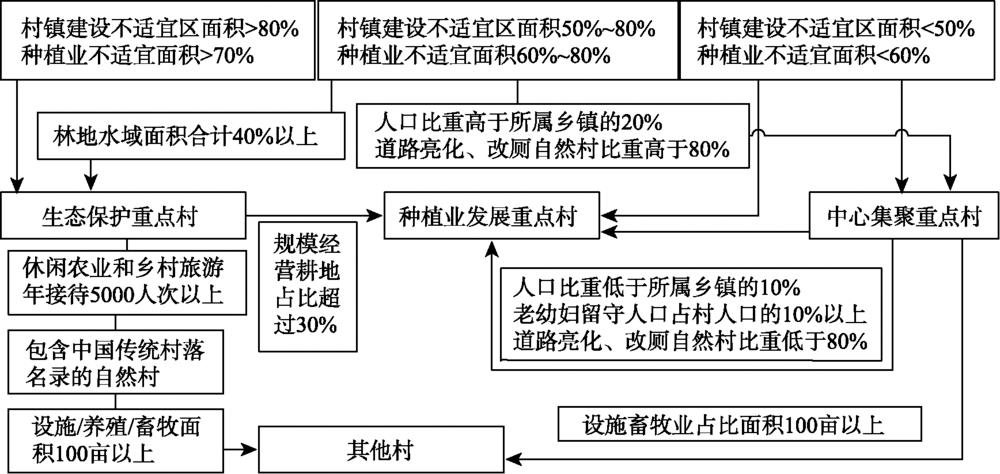
Fig. 1. Village classification based on the suitability of the resources and environmental carrying capacity in Yongfeng County
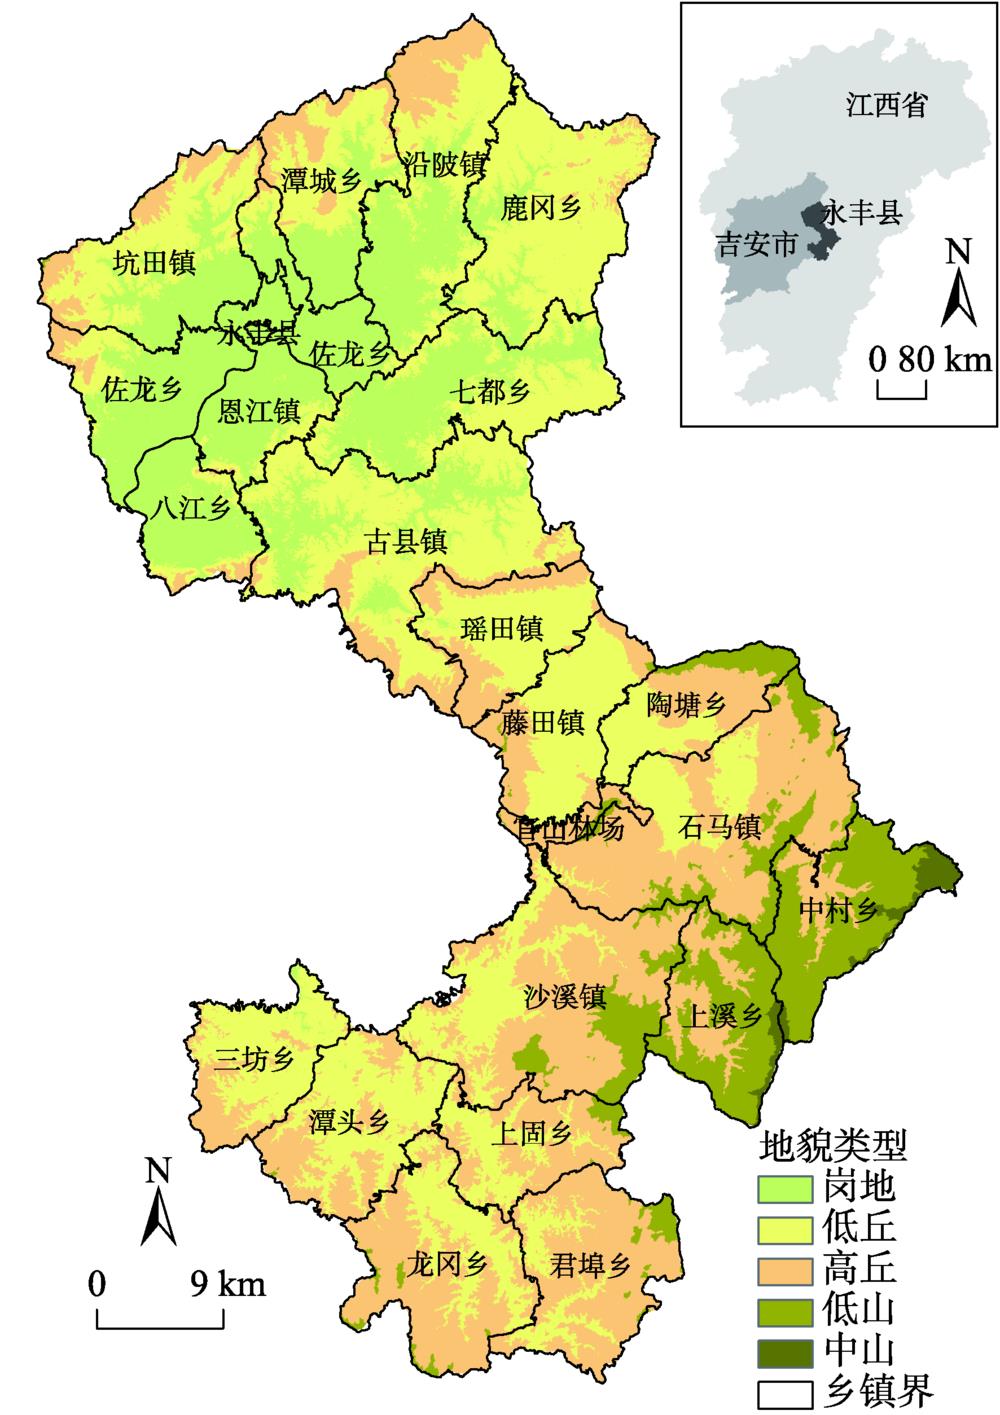
Fig. 2. Location, administrative division, and topographic map of Yongfeng County
Fig. 3. Result of unsuitable areas for cropping and village and town development, and their proportion in each village
Fig. 4. Village classification scheme based on the suitability of resources and environment in Yongfeng County
|
Table 1. Main indicators for the non-suitability evaluation of cropping and village and town development
|
Table 2. High risk area of main geological disasters
|
Table 3. Proportion of cultivated land and construction land in various main functional zones of Ji’an City and Yongfeng County
|
Table 4. Development intensity control coefficients of four types of villages and towns
| ||||||||||||||||||||||||||||||||||||||||||||||||||||||||
Table 5. Suitable area for various villages
|
Table 6. Estimated population size based on suitable area for cropping
|
Table 7. Estimated population size based on the suitable area for village and town development

Set citation alerts for the article
Please enter your email address
© Copyright 2018-2021 | Chinese Laser Press. All Rights Reserved 沪ICP备15018463号-20