
Enhao Feng, Rong Chen, Shixiong Di, Zhanwei Zhou, Xiaogang Yin, Nan Kang, Xin Lin. Effect of Heat Treatment on Microstructure and Mechanical Properties of TC4 Alloy by Selective Laser Melting[J]. Chinese Journal of Lasers, 2024, 51(10): 1002321
- Chinese Journal of Lasers
- Vol. 51, Issue 10, 1002321 (2024)
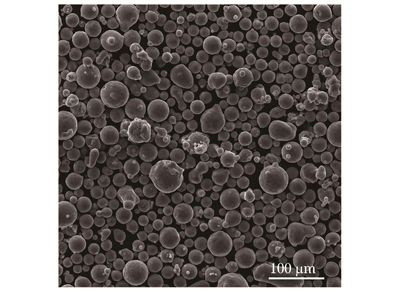
Fig. 1. Morphology of TC4 titanium alloy powder
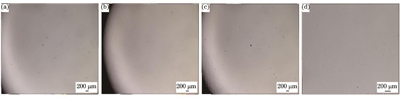
Fig. 2. OM images of SLM TC4 titanium alloy. (a) As-deposited state; (b) annealed state; (c) solution state; (d) solution and aging state
Fig. 3. Metallographic photographs of SLM TC4 titanium alloy sample at different magnifications. (a) 100 times (parallel to deposition direction); (b) 500 times (parallel to deposition direction); (c) 100 times (perpendicular to deposition direction); (d) 500 times (perpendicular to deposition direction)
Fig. 4. OM tissue photos of SLM TC4 titanium alloy sample at different magnifications. (a) 100 times (annealed state); (b) 500 times (annealed state); (c) 100 times (solution state); (d) 500 times (solution state); (e) 100 times (solid solution and aging state); (f) 500 times (solid solution and aging state)
Fig. 5. SEM photos of SLM TC4 titanium alloy sample at different magnifications. (a) 1000 times (as-deposited state); (b) 30000 times (as-deposited state); (c) 1000 times (annealed state); (d) 30000 times (annealed state); (e) 1000 times (solution state); (f) 30000 times (solution state); (g) 1000 times (solid solution and aging state); (h) 30000 times (solid solution and aging state)
Fig. 6. Phase content distribution of SLM TC4 titanium alloy in different states. (a) Deposition state; (b) annealed state; (c) solid solution state; (d) solid solution and aging state; (e) α and β phases content comparison histogram
Fig. 7. EBSD grain orientation diagrams of SLM TC4 titanium alloy in different states. (a) Deposition state; (b) annealed state; (c) solid solution state; (d) solid solution and aging state; (e) α and β phases orientation reference map
Fig. 8. KAM diagrams of SLM TC4 titanium alloy samples in different states. (a) Deposition state; (b) annealed state; (c) solid solution state; (d) solid solution and aging state
Fig. 9. Tensile stress-strain curves of TC4 titanium alloy in different states. (a) Deposition state; (b) annealed state; (c) solid solution state; (d) solid solution and aging state
Fig. 10. Comparison of yield strength and tensile strength of TC4 titanium alloy in different states
Fig. 11. Comparison of plastic properties of TC4 titanium alloy in different states
Fig. 12. Fracture morphologies of SLM TC4 titanium alloy tensile sample under different states. (a) 500 times (as deposited state); (b) 5000 times (as deposited state); (c) 500 times (annealed state); (d) 5000 times (annealed state); (e) 500 times (solid solution state); (f) 5000 times (solid solution state); (g) 500 times (solid solution and aging state); (h) 5000 times (solid solution and aging state)
|
Table 1. Composition of TC4 titanium alloy powder
|
Table 2. Mechanical properties of SLM TC4 titanium alloy in different states

Set citation alerts for the article
Please enter your email address
© Copyright 2018-2021 | Chinese Laser Press. All Rights Reserved 沪ICP备15018463号-20