Meiping SUN, Weiqian MA, Xiaojun YAO, Linlin ZHAO, Zhongqin LI, Dahe QIN. Evaluation and spatiotemporal characteristics of glacier service value in the Qilian Mountains[J]. Journal of Geographical Sciences, 2020, 30(8): 1233
Copy Citation Text
Glaciers provide essential resources and services for human well-being and socio-economic development in arid regions. It is of great significance for regional socio- economic sustainable development and environmental protection to conduct a glacier service value assessment and to analyze its spatiotemporal characteristics. Based on the first and second Chinese glacier inventories of the Qilian Mountains, a glacier service value evaluation system was established. Then the glacier service value and its spatiotemporal variation were assessed by combining the methods of unit area service price, value equivalent factor, and the glacier service value change index (GSCI). Three key results were obtained. (1) The total service value of glaciers in the Qilian Mountains for 2016 was 24.354 billion yuan. The main services provided were climate regulation and runoff regulation, which accounted for 60.58% and 33.14% of the total service value, respectively. Minor services were freshwater supply and hydropower, which accounted for 3.47% and 1.75% of the total value, respectively. The value of other types of services was about 0.259 billion yuan. (2) Among the various river systems in the Qilian Mountains, the Shule River basin had the highest glacier service value (7.771 billion yuan, 31.91%), followed by the Haltang River basin (4.321 billion yuan, 17.74%) and the Beida River basin (3.281 billion yuan, 13.47%). In terms of administrative divisions, the glacier service value of the Qilian Mountains in Qinghai Province was 1.138 billion yuan higher than that of Gansu Province at 11.608 billion yuan, of which the services in the Haixi Mongol and Tibetan Autonomous Prefecture and Jiuquan City were valued at 11.124 (45.68%) and 7.758 (31.86%) billion yuan, respectively. (3) During the period from 1956 to 2010, the service value of glaciers in the Qilian Mountains declined by 435 million yuan, with an acceleration in the decreasing trend from west to east.
Glaciers are an important component of the cryosphere. They are not only considered to be a sensitive indicator of climate change, but also have a profound impact on the natural and human systems of the surrounding region (Qin et al., 2014, 2017). China possesses most of the world's mid-low latitude glaciers and they are also largely located in arid regions (Wang and Su, 2003). Glaciers and their meltwater play an important role in the regulation of river runoff in the arid areas of northwest China, and constitute the material and cultural basis for the sustainable development of population, resources, ecology, environment, and the socio-economy in the region (Wang and Su, 2003; Gagné et al., 2014; Qin et al., 2014, 2017). The Hexi Corridor, which is nurtured by glacier meltwater from the Qilian Mountains, is not only a vital part of the “Silk Road Economic Belt,” but also an important trade and cultural exchange channel in Eurasia. Glacial resources have a wide and profound impact on the utilization of water resources, oasis ecology, and environmental security in Gansu and Qinghai provinces (Sun et al., 2018). Under global warming, glaciers are generally shrinking and thinning (Kraaijenbrink et al., 2017; IPCC, 2018), and there has been a gradual realization that the decline of glacial function will lead to a reduction in the beneficial effects of glaciers (Barnett et al., 2005; Xiao et al., 2015, 2019; Wang et al., 2019). With the expansion of oases and cities in arid regions of China (Zhang et al., 2011), the need to balance the supply and demand of water resources has become increasingly prominent, which has led to the functions and services of glaciers receiving further attention.
As with other ecosystems, glaciers have unique features and function as service systems. Through the exchange of material and energy, glaciers promote the mutual feedbacks involved in the connection of the atmosphere, water cycle of the hydrosphere, land surface processes in the lithosphere, and biological processes in the biosphere. These functions are extremely significant for the Earth's surface processes and human life. Glacier services are products or benefits that humans directly or indirectly obtain from glaciers, such as freshwater resources, hydroelectric energy, climate regulation, and ice and snow tourism (Xiao et al., 2015, 2019). There is a need to determine how much glaciers contribute to human well-being. A glacial service value evaluation could build a bridge between glacial services and the market value system, and provide glacial service and value information for decision makers. Therefore, glacial service value evaluation has become a hot topic in glaciology.
Some researchers have systematically explored ecosystem service functions and value evaluation methods, mainly focusing on the analysis and value evaluation of the service functions of typical ecosystems (e.g., forest, grassland, desert, farmland, and wetland) (Bateman et al., 2013; Costanza et al., 1997, 2014). However, as a special and important part of the ecosystem, glacier service value has not been given sufficient attention due to a lack of public awareness. Xiao et al. (2015) proposed the concept of cryosphere function and service for the first time, bringing an international dimension to the issue. The total value of China's glacier services were preliminarily evaluated using the unit area value equivalent factor method based on expert knowledge (Xie et al., 2015). The ecological service value of glaciers in the Tianshan Mountains of northwest China was evaluated by the unit area service price method (Zhang et al., 2019). The value of lost snow services in the Irtysh River basin was evaluated using the unit area service price method (Yang et al., 2019). Unfortunately, there has been no unified evaluation index system or methodology developed for the evaluation of glacier service value, and studies of glacier service value and its spatiotemporal changes are still quite limited. This study first constructed a system to evaluate glacial service value, which was guided by theoretical work in the fields of glaciology, geography and ecological economics. Based on the revised first and second Chinese glacier inventories of the Qilian Mountains, we then quantitatively evaluated the service value of glaciers in the Qilian Mountains and its spatiotemporal changes, using the methods of unit area service price, value equivalent factor, and glacial service value change index.
2 Study area
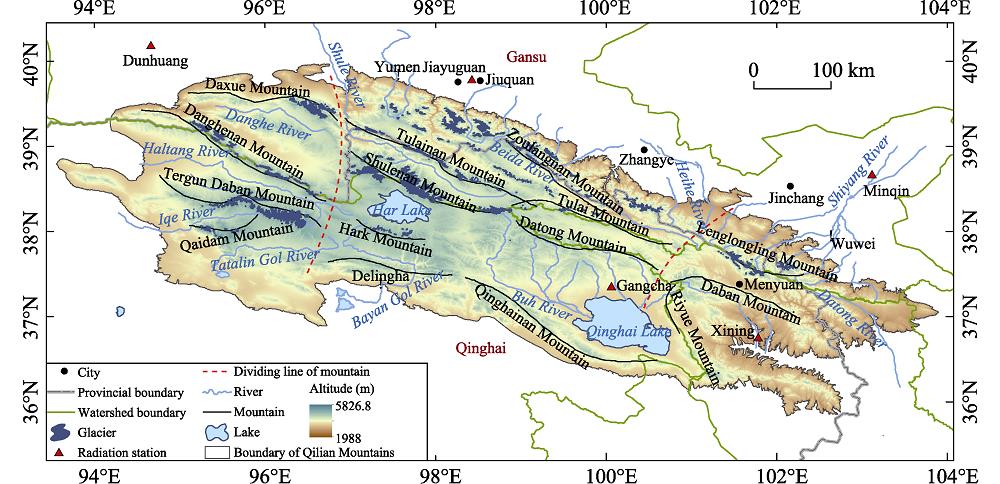
The Qilian Mountains are located in the northeastern margin of the Tibetan Plateau and have an area of 2,062 km2 and an elevation of 1,988-5,826.8 m. They stretch for ~800 km from Wushaoling to the Dangjin Mountain Pass in the east-west direction, and for 200-400 km from the Hexi Corridor to the Qaidam Basin in the north-south direction (Jia et al., 2008; Liu et al., 2017; Sun et al., 2018). Taking Qinghai Lake and Har Lake as boundaries, the Qilian Mountains region can be divided into eastern (Wuwei-Laji Mountain), central (Jiuquan-Delingha), and western (Yingzui Mountain-Dachaidan) sections (Sun et al., 2018) (Figure 1). The Qilian Mountains have a typical continental and plateau climate (Liu et al., 2017). The average annual temperature is 5℃. Precipitation is mainly concentrated in the period from May to September and displays a pronounced spatial difference. The annual precipitation is ~500 mm in the eastern part of the mountain area, but is less than 20 mm in the western part of the Qaidam Basin. Glaciers have developed in the high mountains (>4000 m a.s.l.) and their meltwater is an important source of runoff supply for the Datong River basin (5J4), which contains the northern tributary of the Yellow River, as well as the Hexi (5Y4) and Qaidam (5Y5) interior areas. According to the second Chinese glacier inventory, there are 2683 glaciers in the Qilian Mountains, with an area of 1597.81 km2 and an ice reserve of ~84.48 km3. Under the background of global warming, the glaciers in this region have shown a trend of accelerated retreat (Tian et al., 2014).
The glacier data for the Qilian Mountains used in this study were from the first and second Chinese glacier inventories (Liu et al., 2014). The details of the processing method, data revision, and error correction used in these two datasets are published elsewhere (e.g., Wang et al., 1981; Guo et al., 2015; Liu et al., 2015). In this study, the annual total solar radiation data for five stations (Minqin, Jiuquan, Dunhuang, Xining, and Gangcha) in the Qilian Mountains region in 2016 (Figure 1) were adopted, which were obtained from the China Meteorological Data Service Center (http://data.cma.cn). The emission intensity of air pollutants including sulfur dioxide, nitrogen oxides, and dust was obtained from the Data Service website (http://www.3edata.com) and the air quality indicators for Gansu and Qinghai in 2016 were also used. The cost of sulfur dioxide, nitrogen oxide, and dust treatment was in accordance with the forestry industry standard of the Forest Ecosystem Service Function Evaluation Specification, People's Republic of China (LY/T1721-2008). Statistical data regarding the purchase price index of industrial producers and the consumer price index of residents were obtained from the China Statistical Yearbook (1978-2017). The annual gross tourism income and gross regional product (GRP) of Gansu and Qinghai provinces were obtained from the Gansu Development Yearbook 2017 and Qinghai Statistical Yearbook 2017. The average grain output and average grain selling price were obtained from the National Agricultural Product Cost-Benefit Data Compilation 2017.
3.2 Calculation of glacier volume and its variation
Glacier volume is the basic data used to calculate a glacier's water resource and predict its variation. In this study, an empirical volume-area formula was used to calculate glacier volume (Chen and Ohmura, 1990):
$\text{ }\!\!~\!\!\text{ }V~=c{{S}^{\gamma }}$
where V is glacier volume (km3); S is glacier area (km2); and c and γ are empirical coefficients. Empirical values proposed by Radic and Hock (2010), Shi (2005), and Liu et al. (2003) were used in this study, with the average values of the three methods used as the coefficients.
The change of glacier volume was defined as the difference between the corresponding glacier volumes in the first and second Chinese glacier inventory datasets. Due to the large time span over which the data was collected in the first glacier inventory of the Qilian Mountains, the rate of change of glacier volume was used to facilitate a comparison of the glaciers in different watersheds (Sun et al., 2018). The formula used for the calculation is:
where VGRC is the rate of change of glacier volume (km3/a); Vs and Vf are the glacier volumes (km3) in the second and first glacier inventories; and Ys-f is the time interval between the data collection (a) of the two glacier inventories, which was calculated using the following formula:
where Vi and Yi are the glacier volumes and the year of data collection, respectively, for the i-th glacier in a watershed during the second glacier inventory; Vj and Yj are the glacier volumes and the year of data collection, respectively, for the j-th glacier in a watershed during the first glacier inventory; and m and n are the total number of glaciers in the basin during the second and first glacier inventories, respectively.
3.3 Glacier service value evaluation system
Each service that glaciers provide to human society depends on the functions of glaciers, and is dependent on the environmental characteristics and processes of glaciers (Su et al., 2019) (see Figure 2). Compared with other environmental features or objects, glaciers are characterized by a high albedo, high thermal insulation, and exist in the solid state. Glacier processes include glacier changes and their interactions with the atmosphere, hydrosphere, lithosphere, biosphere, and human system. Glaciers thus play an important role in regulating the earth system at different spatial and temporal scales through complex feedback processes, such as energy and material exchange (Marshall, 2011; Xiao et al., 2015). The presence of glaciers can change the surface energy balance, water balance, water cycle and hydrological processes. They also promote hydrothermal exchange in cold and arid regions, the biogeochemical cycle on the land surface, and the storage and migration of nutrients and pollutants. These glacier functions are determined by the inherent properties of glaciers. At the same time, glaciers also provide services that meet human needs and value orientation (Xiao et al., 2015, 2019; Su et al., 2019). Glacier services are an expression of their functions, but these functions and services do not correspond to each other. They generally have relationships such as “one to many” or “many to one.”
Figure 2.
The glacier service value assessment system framework
The diversity of glacier services determines their value classification. Based on the Millennium Ecosystem Assessment (2005) and referring to the function framework of cryosphere services (Xiao et al., 2015), glacier services can be classified into four types: supply, regulation, support, and cultural services. These services can be further divided into freshwater supply, hydropower, climate regulation, runoff regulation, gaseous pollutant regulation, environmental purification, habitat support, aesthetic appreciation and tourism recreation, and scientific research and environmental education. According to the mode and degree of human benefit, the value obtained by using a glacier service can be divided into direct and indirect use values. Direct use value refers to the value that glaciers can provide directly by meeting the current production or consumption demand, including output value (e.g., freshwater supply and hydropower) and non-output value (e.g., habitat support, aesthetic appreciation and recreation, and scientific research and environmental education). This value is mainly related to the provision of supply, support, and cultural services. Indirect use value is the functional benefit obtained indirectly from glaciers, such as life support to ecosystems (e.g., climate regulation, runoff regulation, gaseous pollutant regulation, and environmental purification). This value is mainly related to the provision of regulation services. The methods currently used to estimate ecological service value can be roughly divided into two categories: the unit area service price (Yang et al., 2019; Zhang et al., 2019) and value equivalent factor (Xie et al., 2003, 2015). When evaluating the service value of glaciers in the Qilian Mountains, both the unit area service price and value equivalent factor methods were used to evaluate their economic values. The results obtained using the two methods were compared and used to comprehensively evaluate the spatial distribution and spatiotemporal characteristics of the service value of glaciers.
3.3.1 Unit area service price method
The unit area service price method is largely a combination of the market value method, shadow engineering method, shadow price method, travel cost method, expense payment method, and conditional value method (Yang et al., 2019; Zhang et al., 2019). By combining the characteristics of glaciers in the Qilian Mountains and regional features, evaluation methods and suitable parameters for determining glacier services were obtained (Table 1).
Vw is the value of the glacier freshwater supply (yuan); VGRC is the annual change of glacier volume (km3 / a); glacier density (ρg) is 0.917 × 10³ kg/m3; water density (ρw) is 1.0 × 10³ kg/m3; Pw is the price of freshwater, with reference to the price of water supplied in the Qilian Mountains in 2016 (1.75 yuan/m3).
The annual change of glacier volume was converted into the annual freshwater provided to the social and natural environment by glaciers, and its economic value was calculated according to water prices.
Vp is the value of glacier hydropower (yuan); Qilian Mountains glacial meltwater (Vm) has a volume of 11.32 × 10⁸ m3/a (Qin et al., 2017); RC is the energy generated from a unit of reservoir capacity (kW·h / m3); Pp is the price of hydropower. The 2016 on-grid price of small hydropower in the Qilian Mountains was 0.257 yuan/kW·h.
The glacial meltwater was converted into the total storage capacity of reservoirs in the Qilian Mountains, and the value of glacier hydropower was calculated based on the energy generated from a unit of reservoir capacity in the area and the price of hydropower.
Vc is the glacier climate regulation value (yuan); Sg is the Second Glacier Inventory glacier area (km2); R is the annual total solar radiation of a unit area in the Qilian Mountains (MJ / m2·a); glacier albedo (αg) is 0.6 (Qin et al., 2017); terrain occlusion rate (αs) is 0.5; VGRC is the annual change of glacier volume (km3/a); ρg is the density of glaciers; the latent heat of melting of glaciers (qg) is 3.35 × 10⁵ J/kg; Pe is the average electricity price of 0.51 yuan/kW·h for various industries in the region in 2016; η is the thermal-power conversion efficiency.
The sum of the solar energy reflected by the glacier surface and the heat absorbed by the glacier melt was used as the contribution of the glacier to suppress climate warming. The heat energy was converted into electrical energy, and the value of glacier climate regulation was calculated by reference to the electricity price (Zhang et al., 2019).
Vr is the glacier runoff regulation value (yuan); Vm is the Qilian Mountains glaial melt water (m3 / a); Pr is the engineering cost of a unit of reservoir storage capacity in 2016 (7.131 yuan / m3).
The glacial meltwater was converted into mountain reservoir capacity, and then combined with the engineering cost of the unit reservoir storage capacity to calculate the glacier runoff adjustment value.
Vg is the glacier gaseous pollutant regulation value (yuan); Qso2 and QNOx are the amounts of sulfur dioxide and nitrogen oxides absorbed by a unit area of glaciers, respectively, with reference to the sulfur dioxide and nitrogen oxide emission intensity of Gansu and Qinghai provinces; Sg is the glacier area of the Second Glacier Inventory (km2); Pso2 and PNOx are the sulfur dioxide and nitrogen oxide treatment costs in 2016 (1.689 and 0.887 yuan/kg, respectively).
The gaseous pollutant regulation value was calculated according to the amount of sulfur dioxide and nitrogen oxide absorbed by the glacier area of the Qilian Mountains and their treatment costs.
Ve is the environmental value of glacier purification (yuan); Qdust is the amount of dust absorbed by a glacier of unit area, with reference to the dust emission intensity of Gansu and Qinghai provinces; Sg is the glacier area of the Second Glacier Inventory (km2); the dust treatment cost (Pdust) is 0.211 yuan/kg.
The value of environmental purification services was calculated based on the amount of dust adsorbed on the glacier area of the Qilian Mountains and its treatment costs.
Vh is the value of the glacier habitat support (yuan); Sg is the glacier area of the Second Glacier Inventory (km2); Ph is the average annual amount invested in Qilian Mountain ecological protection and governance per unit area, with reference to the “Qilian Mountains Ecological Protection and Construction Comprehensive Management Plan (2012-2020)”. The total investment was 7.99 billion yuan, and the estimated Ph was 6262.98 yuan/km2.
By considering glaciers to be an important feature of nature reserves, the value of glacier habitat support was estimated based on the investment in major ecological protection and construction management projects in the Qilian Mountains per unit area.
Cultural service
Aesthetic appreciation and recreation
Combination of travel cost method and conditional value method${{V}_{t}}=S\times {{R}_{g}}\times \frac{{{S}_{\text{g}}}}{{{S}_{t}}}$
Vt is the value of glacier aesthetic appreciation and recreation (yuan); S is the total annual tourism income of Gansu and Qinghai provinces; Rg is glacier-related tourism expenses as a proportion of total tourism expenses; Sg is the glacier area of the Second Glacier Inventory (km2); St is the total area of glaciers in Gansu and Qinghai provinces (km2).
Statistics from a questionnaire survey that was distributed to Chinese and foreign tourists were used to obtain glacier tourism-related expenses as a proportion of total tourism expenses. Together with the total annual tourism income of Gansu and Qinghai provinces, this was used to estimate the value of glacier aesthetic appreciation and recreation.
Vs is the value of glacier scientific research and environmental education (yuan); Pt is the annual economic value of the Qilian Mountains glacier's for teaching practices (529.4 × 10⁴ yuan) (Wang et al., 2012); Pf is the research funding for the Qilian Mountain Glacier in the National Natural Science Foundation of China in 2016 (4.14 million yuan).
The value of glacier scientific research and environmental education was evaluated based on the cost of the actual teaching practices undertaken and the level of National Natural Science Foundation project funding.
Table 1.
Evaluation methods and parameters used to determine glacier service values in the Qilian Mountains
Based on the principle of Costanza et al. (1997), and with reference to the equivalent service value per unit area of China's terrestrial ecosystems (Xie et al., 2015), the equivalent unit price of each glacier service to that of the ecological services provided by farmland was determined. The glacier service value was then calculated:
where V is the total value of the glacier service (yuan); ei is the equivalent value of a unit area of the i-th service of the glacier; the economic value (Ea) of one ecological service has a value equivalent to 1/7 of the national average grain yield market value in that year (Xie et al., 2003), the national average grain output in 2016 was 6856.95 kg/hm2, and the national average grain price in 2016 was 2.17 yuan/kg, from which Ea was 2125.65 yuan/hm2; and Sg was the glacier area from the second glacier inventory (km2).
3.4 Glacier service value change index (GSCI)
The GSCI was used to characterize the relative gain or loss of the glacier service value. A GSCI value of 0 indicates that the value of the glacier service has not changed, a negative value indicates a loss, and a positive value indicates a gain:
$GSCI=\frac{G{{S}_{s}}-~G{{S}_{f}}}{G{{S}_{f}}}$
where GSs and GSf represent the glacier service value in the final and initial states, respectively.
4 Result and analysis
4.1 Service value of glaciers in the Qilian Mountains
The magnitude of the glacier service value directly reflects the strength of the function, service, and stability of a glacier. Based on the unit area service price method, the total value of glacier services in the Qilian Mountains in 2016 was approximately 24.354 billion yuan, of which the value of regulation services for indirect use was 22.858 billion yuan, far greater than the direct use value (1.496 billion yuan). The direct economic value therefore accounted for less than 6% of the total service value (Table 2). In terms of service indicators, the order of the service values was as follows: climate regulation > runoff regulation > freshwater supply > hydropower > aesthetic appreciation and recreation > gaseous pollutant regulation > habitat support > scientific research and environmental education > environmental purification. Among them, the regulation service value of glacier meltwater to river runoff was 8.072 billion yuan (33.14%), the service value of freshwater supply was 844 million yuan (3.47%), and the service value of hydropower using glacial melt water and the large elevation gradient was 425 million yuan (1.75%), which further highlighted the importance of glacier melt water to the productivity and livelihoods of the local population, and the overall ecological and economic development in arid regions. The value of the high albedo and heat absorption that induced melting of the surface of the glacier was 14.754 billion yuan (60.58%), which indicates that glaciers in the Qilian Mountains play a large role in slowing down the regional temperature rise under the background of global warming. The service value of gaseous pollutant regulation, environmental purification, habitat support, aesthetic appreciation and recreation, and scientific research and environmental education was 259 million yuan, accounting for only 1.06% of the total service value. However, as an important ecological security barrier in the whole northwest region, glaciers in the Qilian Mountains play an important role in maintaining the balance of atmospheric chemical components, and diluting and transferring pollutants. Additionally, the glaciers in the Qilian Mountains occupy a vast space and have a huge potential for tourism development. In addition, glaciers provide important scientific research sites for undertaking cryosphere scientific research, the popularization of cryosphere knowledge, and the cultivation of cryosphere science professionals (Qin et al., 2017), which are services that cannot be ignored.
Service type
Service price method
Value equivalent factor method
First level
Second level
Service value (100 million yuan)
Percentage (%)
Service value (100 million yuan)
Percentage (%)
Supply service
Freshwater supply
8.44
3.47
7.34
21.04
Hydropower
4.25
1.75
-
-
Regulation service
Climate regulation
147.54
60.58
1.83
5.25
Runoff regulation
80.72
33.14
24.22
69.44
Gaseous pollutant regulation
0.30
0.12
0.61
1.75
Environmental purification
0.02
0.01
0.54
1.55
Support service
Habitat support
0.10
0.04
0.03
0.08
Cultural service
Aesthetic appreciation and recreation
2.08
0.85
0.31
0.89
Scientific research and environmental education
0.09
0.04
-
-
Total
243.54
100.00
34.88
100.00
Table 2.
Service value of glaciers in the Qilian Mountains for 2016
Due to the limitations of the evaluation methods and data, it was difficult to use the unit area service price method to estimate the spatial characteristics and spatiotemporal changes of the glacier service value, and therefore the unit area value equivalent factor method was used to determine the service value. It can be seen from Table 2 that the total service value of glaciers in the Qilian Mountains calculated by the unit area value equivalent factor method was 3.488 billion yuan/year, which was far less than the result obtained using the unit area service price method. Glaciers mainly rely on their high albedo to solar radiation to drive energy and material transformations and their own phase transitions to maintain their functions and services. In previous studies, the glacier value equivalent factor was determined by expert experience (Xie et al., 2015). A lack of consideration of the spatiotemporal differences in the quality of glaciers will inevitably cause a certain error in the calculation of regional glacier service values (Zhang et al., 2019). The parameters involved in the unit area service price method include the natural attributes of glaciers and the potential marginal benefits of glacier services. The results of the estimation can better reflect the dynamic changes of glaciers in time and space, with a high degree of reliability. Therefore, this study used the results of the calculated unit area service price method to modify the glacier value equivalent factor to obtain the service value equivalent factor of glaciers in the Qilian Mountains. The service value equivalent factor of freshwater supply was revised to 2.485, hydropower to 1.251, climate regulation to 43.440, runoff regulation to 23.766, gaseous pollutant regulation to 0.088, environmental purification to 0.006, habitat support to 0.029, aesthetic appreciation and recreation to 0.612, and scientific research and environmental education to 0.026. The spatial distribution and spatiotemporal changes of the service value of glaciers in the Qilian Mountains were evaluated by the modified unit area value equivalent. When calculating the changes of the glacier service value during 1956-2010, inflation factors were considered, and the unit service price was adjusted by the consumer price index for the relevant years.
4.2 Spatial characteristics of glacier service value
4.2.1 Glacier service value of different watersheds in the Qilian Mountains
Glaciers in the Qilian Mountains are situated in three secondary watersheds: Datong River basin (5J4), and the Hexi (5Y4) and Qaidam (5Y5) interior areas (Shi, 2005). The annual service value of glaciers was the highest in the Hexi interior area (15.961 billion yuan), followed by the Qaidam interior area (8.076 billion yuan) and Datong River basin (317 million yuan). There were significant differences in the value of glacier services in the different tertiary watersheds (Figure 3). The value of the services provided by glaciers was the highest in the arid region watersheds located in the western part of the Qilian Mountains. The Shule River basin (5Y44), which is located on the northern side of the central and western sections, had the highest service value of 7.771 billion yuan (31.91% of the total), followed by the Haltang River basin (5Y56, 4.321 billion yuan, 17.74%) on the southern side of the western section and the Beida River basin (5Y43, 3.281 billion yuan, 13.47%) on the northern side of the central section. The glacier service values of Shiyang River (5Y41), Datong River (5J42), Buh River-Qinghai Lake (5Y51) and Bayan Gol River (5Y59) in the eastern central section were all less than 610 million yuan. Bayan Gol River basin had the lowest glacial service value, accounting for only 0.14% of the total value. The spatial differences of the glacier service value in each basin of the Qilian Mountains were largely a consequence of the size of the glacier area in each basin.
Figure 3.
Service value and percentage of glacier cover in watersheds and cities in the Qilian Mountains
4.2.2 Glacier service values of the different provinces (cities) in the Qilian Mountains
In terms of administrative divisions, the glaciers in the Qilian Mountains are affiliated to the cities of Jiuquan, Zhangye and Wuwei in Gansu Province, and Haixi Mongol and Tibetan Autonomous Prefecture and Haibei Tibetan Autonomous Prefecture in Qinghai Province. The annual service value of glaciers in Gansu was 11.608 billion yuan. The glacier resources of the Qilian Mountains in Gansu are mainly distributed in Jiuquan and Zhangye, and the glacier area and ice reserves of Jiuquan are more than twice and three times those of Zhangye, respectively. In terms of the glacier service value of each city (Figure 3), Jiuquan had a glacier service value of 7.758 billion yuan (31.86% of the total), Zhangye had a glacier service value of 3.754 billion yuan (15.41%), and Wuwei had a glacier service value of 96 million yuan (0.39%). The glacier area and volume in the Qilian Mountains in Qinghai were larger than the corresponding values in Gansu, and the total annual service value of glaciers was 1.138 billion yuan more than that in Gansu. The glacier service values of the prefectures of Haixi and Haibei were 11.124 billion yuan (45.68%) and 1.622 billion yuan (6.66%), respectively. Haixi had the highest service value of all the cities and prefectures.
4.3 Spatiotemporal changes of the service value of glaciers in the Qilian Mountains
According to the statistics of the first and second glacier inventories of the Qilian Mountains, the glacier area and glacier volume decreased by 417.15 km2 and 21.16 km3 from 1956 to 2010. As a consequence of the glacier retreat, the total value of glacier services decreased by approximately 435 million yuan (-2.05%) over this period.
In the different watersheds, there were gains in the glacier service value in the western section of the Qilian Mountains and losses in the eastern-central section (Figure 4a). The largest loss of glacial service value (-40.31%) occurred in the Datong River basin (5J4), while in the Hexi interior area (5Y4) the loss was -5.30%. In contrast, in the Qaidam interior area (5Y5) the service value increased by 8.02%. Specifically, the loss in glacier service value in the Datong River basin (5J42), which is located in the eastern central section of the Qilian Mountains, was -40.31%; while the losses in the Heihe River (5Y42), which is located on the northern side of the central section, and the Shiyang River (5Y41), which is located on the northern side of the eastern section, were -33.45 % and -23.98%, respectively. In the central section of the Buh River-Qinghai Lake basin (5Y51), and the Beida (5Y43) and Bayan Gol (5Y59) rivers, the changes in glacier service value ranged from -16.37% to -4.65%. The gains in glacier service value in the five basins west of Har Lake (5Y57) were all greater than 2.81%, of which the Iqe River-Tatalin Gol River basin (5Y58) glacier service value gain was the largest at 10.08%. The loss of service value of glaciers in the eastern-central section of the Qilian Mountains was the result of the large-scale retreat of glaciers, while the rates of decline in glacial area in the five basins west of Har Lake were lower than those in the eastern-central section basins (Sun et al., 2018). The gains in glacier service value in the five basins to some extent compensated for the loss of service value caused by the retreat of glaciers, resulting in a slight increase in the service value of glaciers in the western section. For the whole Qilian Mountains, the overall gains in glacier service value were far less than the impact of glacier retreat on glacial service value, resulting in an overall decrease of service value.
Figure 4.
Changes in the service value of glaciers in different watersheds (a) and cities (b) in the Qilian Mountains from 1956 to 2010
Over the past 50 years, the service value of glaciers in the Qilian Mountains in Gansu and Qinghai provinces has declined by 393 million and 42 million yuan, respectively. Figure 4b shows the value changes in each city or autonomous prefecture. Wuwei and Haibei, which are located in the eastern section of the Qilian Mountains, experienced large losses in glacial service value of -36.37% and -28.70%, respectively. In contrast, Jiuquan and Haixi gained service value of 5.04% and 5.74%, respectively. These results showed that the service value changes of glaciers in the Qilian Mountains presented a general longitudinal zonality, with the losses tending to increase from west to east.
5 Discussion
The ecosystem in the Qilian Mountains is similar to that of other mountain systems in arid areas of northwest China. From alpine glaciers, forests, and high altitude grasslands to farmland at low altitudes, the ecosystem in the Qilian Mountains is complex and each part is interdependent and constrained. To compare the similarities and differences among the four different ecosystems in this region: glacier (this study), forest (Ding, 2014), grassland (Jiao and Zhao, 2013), and farmland (Shi et al., 2013), we collected previously published data to evaluate the service value of the ecosystems in the Qilian Mountains in recent years. The different service evaluation indicators had certain limitations when comparing the proportional contributions of different services in the various ecosystems, but they could still provide a basis for evaluating their relative contribution (Zhang et al., 2019). Table 3 shows the proportional contribution of various ecological services to the total service value for the different ecosystems in the Qilian Mountains. Freshwater supply / product supply, climate regulation, and runoff regulation/water conservation were all relatively important in the complex ecosystems. The combined contribution of these three services in glacier, forest, grassland, and farmland ecosystems in the Qilian Mountains accounted for 97.19%, 49.40%, 87.93%, and 52.58% of the total service value, respectively. Runoff regulation/water conservation was the most valuable service (32.09% and 45.48%) in forest and grassland ecosystems, and product supply service was the most important (36.22%) in farmland ecosystems. The climate regulation service provided by glaciers in the mountainous area (60.58%) was far higher than in the other three ecosystems. To enhance the comparability of the unit area service value among glacier, forest, grassland, and farmland ecosystems, the consumer price index was used to transform the service value of each ecosystem into the economic value in 2016. In terms of the service value unit area of the different ecosystems in the Qilian Mountains, forest ecosystems had the highest value (213,700 yuan/hm2), followed by glacier ecosystems (152,400 yuan/hm2), while grassland and farmland ecosystem values were relatively small (12,600 and 7700 yuan/hm2, respectively). This means that glaciers, like other ecosystems, provide a complete service system. Glaciers and their meltwater can maintain the complex ecosystem of arid areas, and this is directly related to the sustainable development and healthy operation of the regional eco-economic system.
Service type
Percentage of ecosystem service value (%)
Glacier
Forest
Grassland
Farmland
Freshwater supply/Product supply
3.47
16.13
3.17
36.22
Hydropower
1.75
-
-
-
Climate regulation
60.58
1.18
39.28
9.77
Runoff regulation/Water conservation
33.14
32.09
45.48
6.59
Gaseous pollutant regulation/Carbon fixation & release of oxygen
Glacier services provide support to industrial activities by providing the means to transform materials into products or influencing the production process, and the service value directly or indirectly affects the output value of industrial activities. Therefore, the proportional relationship between the value of glacier services and GRP reflects the contribution of glacier services to regional economic development, i.e., the dependence of regional economic development on glacier services. In this study, the value of glacier services accounted for 12.01% of the GRP (202.72 billion yuan) of the five cities (or prefectures) in the Qilian Mountains. This indicates that about one-eighth of the GRP of the Qilian Mountains region in 2016 was obtained through glacier resources and services, indicating that glaciers play an important role in the productivity and livelihoods of local people, and ecological economic development in arid areas. In the Qilian Mountains, the glacier service value of Haixi contributed the most to GRP (22.84%), followed by Haibei (16.11%). The regional economic development of Wuwei had the least dependence on glacier services (0.21%), which provides a reference for the future ecological protection and ecological asset accounting of the region.
Although the assessment results quantitatively reflected the service value and spatiotemporal variation of glaciers in the Qilian Mountains to a certain extent, the complex processes and functions of glaciers, and the relationship between ecological and economic processes require further study. For example, there is a need to investigate glaciers in combination with remote sensing and geographical information system (GIS) technology, which would likely reveal more of the functions and services of glaciers. There is a need to improve the classification of glacier services, the quantitative method used to determine the unit area price of each service, the comparability of glacier service value assessment studies, and the accuracy of service value assessment results. This study only considered the single element of cryosphere-glaciers, and service value evaluations of other components such as snow, frozen soil, river ice, lake ice, and other cryosphere elements will be considered in future research. The next stage of the research will be to integrate the relationships and interactions among the elements of the cryosphere and climate, hydrology, ecology and environment into the same system, and to assess and quantify the changes and eco-economic effects of the components of the cryosphere caused by past, present and future climate change.
6 Conclusions
(1) Based on the first and second glacier inventories of the Qilian Mountains, the unit area service price method and the value equivalent factor method were used to evaluate the glacier service value in this mountainous area. In 2016, the service value of glaciers in the Qilian Mountains was 24.354 billion yuan, with climate regulation and runoff regulation constituting the main glacier services in the region, followed by freshwater supply and hydropower. These four services accounted for 60.58%, 33.14%, 3.47%, and 1.75% of the total value, respectively. The value of other types of services was 259 million yuan.
(2) Among the tertiary watersheds in the Qilian Mountains, the Shule River had the highest glacial service value of 7.771 billion yuan (31.91% of the total value), followed by the Haltang and Beida rivers at 4.321 billion yuan (17.74%) and 3.281 billion yuan (13.47%), respectively. The Bayan Gol River had the lowest glacier service value, accounting for only 0.14% of the total value. In terms of administrative divisions, the total annual service values of glaciers in the Qilian Mountains in Gansu and Qinghai provinces were 11.608 and 12.746 billion yuan, respectively. The glacier service values in Jiuquan and Haixi were high, at 7.758 billion yuan (31.86%) and 11.124 billion yuan (45.68%), respectively.
(3) During the period from 1956 to 2010, the glacier service values in the Qilian Mountains declined by 435 million yuan, and the loss of glacier service value displayed an accelerating trend from west to east. Glacier service value changes in the Datong River basin in the eastern-central section of the Qilian Mountains, the Heihe River in the northern side of the central section, and the Shiyang River in the northern side of the eastern section ranged from -40.31% to -23.98%. The glacier services values in the five basins in the western part of Har Lake varied from 2.81% to 10.08%. From the perspective of administrative divisions, Wuwei and Haibei, which are both located in the eastern section of the Qilian Mountains, experienced a large decline in glacier service value of -36.37% and -28.70%, respectively. Jiuquan and Haixi in the central and western sections experienced gains in glacier service value of 5.04% and 5.74%, respectively.
[11] The analysis and evaluation on grassland ecosystem service function value of Shandan Horse Field in Qilian Mountain National Nature Reserve. Journal of Arid Land Resources and Environment, 27, 47-52(2013).
[21] Regional and global volumes of glaciers derived from statistical up-scaling of glacier inventory data. Journal of Geophysical Research Earth Surface, 115, 87-105(2010).
Meiping SUN, Weiqian MA, Xiaojun YAO, Linlin ZHAO, Zhongqin LI, Dahe QIN. Evaluation and spatiotemporal characteristics of glacier service value in the Qilian Mountains[J]. Journal of Geographical Sciences, 2020, 30(8): 1233