We reveal the mechanism of the noncoaxial rotational Doppler effect (RDE) of an optical vortex and report its application in discriminating the orientation of the rotating axis of the rotating body. In most cases of the RDE-based measurement, the beam axis must be aligned with the rotating axis of the rotational body to observe a good signal. Once the beam axis is not coaxial with the rotating axis, the RDE frequency shift would change related to the misalignment distance, which can be called the noncoaxial RDE. Here, we take the advantage of the misaligned RDE augment with precise light-field modulation and successfully realize the discrimination of the orientation of the rotating axis relative to the illuminating beam. We clarify the principle of noncoaxial RDE and explain why the incomplete optical vortex (OV) is sensitive to the position of the rotating axis. We switch the OV field into four quadrants synchronized with sampling by the data acquisition system, and conduct Fourier transformation of the signals. Combined with the fitting algorithm, the orientation of the rotating axis can be recognized directly. This method may find applications for the noncontact detection of rotating bodies in both industrial and astronomical scenarios.
1. INTRODUCTION
As early as 1842, C. J. Doppler published his seminal article introducing the phenomenon that wave frequency will shift when the receiver moves close to or away from the wave source, and since then the term “Doppler effect” has become a well-known item in numerous branches of science and engineering [1,2]. In 1981, the concept of the “angular Doppler effect” was reported for the first time by Garetz et al., which reveals the possibility of using the Doppler effect to detect the movement in the vertical section of the beam [3]. Early research about the rotational Doppler effect (RDE) mainly concentrated on the spinning angular momentum (SAM) carried by the photon that relates to the polarization state of light [4,5]. More recently, Allen et al. published their seminal paper establishing that light beams with helical phase fronts can carry orbital angular momentum (OAM) [6] with a magnitude of , which has led both to new understandings of optical effects and various applications and RDE [7–14]. About ten years after Allen’s research, Basistiy et al. realized the observation of RDE with a helical wavefront beam by employing a spiral zone plate [15,16].
In 2013, Lavery et al. published their findings on spinning object detection by light carrying OAM in Science [17], pushing the research on RDE to the frontier again. At about the same time, Carmelo et al. experimentally demonstrated the mechanism of the transverse velocities’ detection using a structured light beam where each point in its transverse plane is associated with a particular value of the phase [18]. Subsequently, they further realized the detection of all velocity components in a full 3D helical motion and the detection of the rotational direction, which are the pioneering works in the RDE field [19,20]. On these bases, many new techniques have been proposed which greatly enriched the toolbox of currently used detection methods based on Doppler effect [21–26]. Similar to Lavery’s research, all rotational speed measurements mentioned in the above research must meet the requirement that the axis of the optical vortex (OV) be coaxial with the target axis of rotation [27–29]. However, making the two axes coaxial with each other precisely is difficult to realize in practical noncooperative measurement, which may affect the measurement accuracy of RDE-based metrology. To overcome this shortcoming, if we can find a way to sense the position of the rotating axis of the noncooperative object, it will assist in the practical application of RDE.
In most rotational speed measurement cases using RDE, the misalignment between the OV axis and the rotating axis is an annoying factor. It is because the signals change violently as the OV axis moves from the rotating center, which would make the RDE signal predicted by hard to recognize [30,31]. Conversely, this misalignment-sensitive characteristic can be used to sense the rotating axis of the object, which is exactly the main idea of this paper. Moreover, the ring-shaped intensity distribution of the OV has circular symmetry, and it is impossible to sense the orientation of the rotating axis. Once the circular symmetry of the OV is broken, that will empower the circular asymmetry OV to discriminate the orientation of the rotating axis relative to the beam axis, which is a significant breakthrough of this work.
Sign up for Photonics Research TOC. Get the latest issue of Photonics Research delivered right to you!Sign up now
In this work, based on the small scattering model, we investigated the principle of the noncoaxial RDE and proposed the method to discriminate the rotating axis orientation based on the noncoaxial RDE. The noncoaxial RDE occurs when the axis of the illuminating beam is not aligned to the rotation axis of the object. We divide the ring OV field into four parts, corresponding to the four quadrants in a Cartesian system (CS) established with the OV field center as the origin. Since the frequency shift introduced by each scatterer within the OV light field is different under noncoaxial illumination conditions, the total RDE frequency shift introduced by each part of the OV is different. We switch the OV field in four quadrants synchronized with sampling by the data acquisition system and conduct Fourier transformation of the signals; combined with the fitting algorithm, the orientation of the rotating axis can be recognized directly.
2. METHODS AND PRINCIPLES
A. Principles of Noncoaxial RDE
The principle of general linear Doppler effect of an electromagnetic wave can be expressed by [32] where and are the light frequency and speed, respectively, is the velocity of the receiver, and denotes the projection of the velocity vector in the direction of beam propagation.
As the solution of the Helmholtz equation under paraxial approximation, the Laguerre–Gaussian (LG) mode is conceived of as a typical OV beam which carries a well-defined OAM. In the cylindrical coordinate , the linear momentum density, i.e., the Poynting vector components in , , and directions can be given by [33–35]where and are the angular frequency and the wavenumber of the light and is the Rayleigh range of the Gaussian beam. For a well-collimated beam, , and gives the skew angle between the Poynting vector with respect to the beam axis to be . It is clear that in the OV light field, the Poynting vector does not coincide with the beam propagation direction anymore.
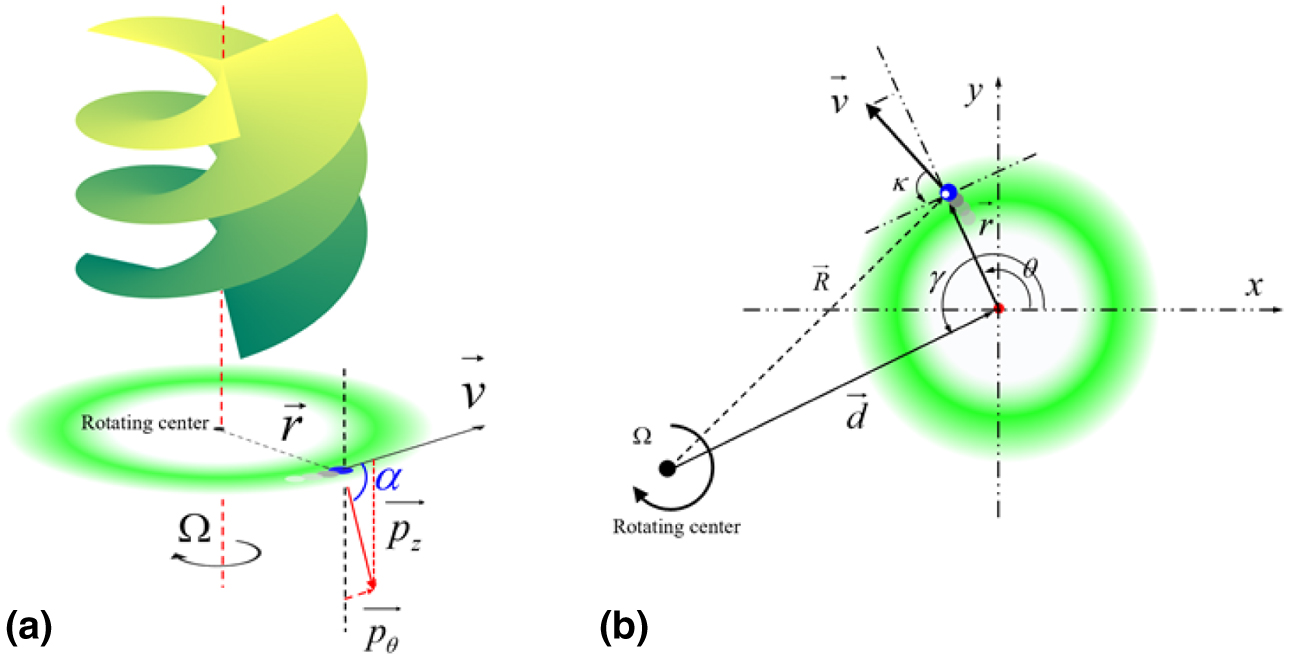
As is presented in Fig. 1(a), the velocity of a rotating small scatterer can be expressed by , where denotes the rotating radius of the small scatterer and is the rotating speed. The relative angle between the Poynting vector and the linear speed of the small scatterer is , which can be expressed by . When the OV light illuminates along the rotating axis, the radius of the light field equals . Putting the scatterer velocity and angle into an equation, the Doppler frequency shift can be obtained as . For a macroscopic rotating object, the same frequency shift will occur for each small scatterer within the light field. Therefore, the echo light from the rotating body would be frequency-shifted uniformly, which is called the RDE frequency shift; this will produce a single peak signal in the frequency spectrum. However, things would be different if the probe OV beam illuminates the rotating object noncoaxially.
Figure 1.Schematic of the coaxial and noncoaxial RDE. (a) A tiny scatterer from a rotating body is taken out to analyze the relationship between the Poynting vector and the scatterer velocity on the condition of coaxial incidence. and are the angular and the propagation component, respectively. (b) The misaligned detection condition under the rotating center completely derivates out of the OV ring. Relative to the CS established with the spot center as the origin, the position of the small scatterer is defined by and , and the position of the rotating center is defined by and . The RDE frequency shift is introduced through the velocity component of the scatterer in the tangent direction.
As shown in Fig. 1(b), when there is a lateral misalignment between the rotating axis and the beam axis, the magnitude of the RDE frequency shift will change accordingly. Here, we establish the CS with the OV spot center as the origin. The orientation of the rotating axis is defined by , and the position of the small scatterer is defined by . On this basis, beam radius and misalignment parameter can be expressed in the vector form, where is the distance from the rotating center to the beam center, denotes the angle between and , and is the angle between and in the CS.
Obviously, the absolute value of can be given by
Based on Eq. (3), the angle between linear speed of the scatter and the OV tangent direction can be given by
Combined with Eqs. (1) and (4), and the geometric relationship of , and , the Doppler frequency shift generated by the scatterer under misaligned illumination conditions is
The above formula shows that the RDE frequency shift is related to the beam radius, lateral misalignment distance, the position of the scatterer, and the orientation of the rotating axis. The frequency shift generated by any small scatterer within the light field can be calculated by Eq. (6). This is the basic mechanism of the noncoaxial RDE. Compared to the lateral misalignment RDE reported in Ref. [30], Eq. (6) is established with the OV spot center as the origin of the CS; an additional parameter that defines the orientation of the rotating axis is included in the expression. Therefore, once the scatter position within the light field is fixed, the frequency shift is affected by the position of the rotating axis. This feature can then be used to sense the orientation of the rotating axis.
Moreover, it can be seen from Eq. (6) that the frequency shift may be negative when , but the RDE frequency shifts are all positive under . Since the detection of the frequency shift is based on the beat frequency phenomenon, the frequency shifts perceived by the photodetector (PD) are all positive values. As the misalignment distance increases, the frequency spectrum may broaden significantly starting from zero to a certain maximum frequency value if the echo light from the whole OV field is received.
B. Determining the Orientation of the Rotating Axis
For a complete OV ring that has good circular symmetry, it is impossible to obtain position information on the rotating axis from the frequency spectrum. Here, we come up with a new method that, by breaking the circular symmetry of the ring shape of the OV beam, the orientation discrimination of the rotating axis can be realized. The whole OV field is divided into four parts, according to the CS established with the spot center as the origin. As shown in the right of Fig. 2, we number the four parts in the four quadrants as A, B, C, and D, respectively. When the OV beam illuminates the surface of the rotating body noncoaxially, the signal spectrum will broaden in a large area according to the principle of noncoaxial RDE. It is hard to achieve some useful information in such a broadened signal, although the target’s rotational speed and rotational axis orientation information are included in the frequency shift. Once we divide the whole circular light field into four parts and illuminate the rotating object by using one of them, the RDE frequency shift will not appear in a wide bandwidth area but appear in a certain area dependent on the position of the rotating axis. For a fixed offset position of the rotating axis, the distribution of the RDE frequency shifts introduced by the four OV parts is different; therefore, we can realize the axis orientation discrimination through the four times measurements.
To clearly clarify the principle of the axis orientating discrimination, we simulated the RDE frequency shift distribution according to Eq. (6). Here, some parameters need to be defined first. We set the topological charge to and the rotational speed to . The beam radius is set to , the corresponding misalignment is set to , and we choose four scatterers within the light field at () to help analyze the frequency shift introduced by the four parts under different orientations of the rotating axis relative to the beam center. The whole flat area is divided into four parts I, II, III, and IV in the CS, such that all the orientations of the rotating axis can be classified into these four areas. The orientation of the rotating axis is determined by , which varies from 0 to .
The simulated results are shown in Fig. 2. The four colored lines represent the RDE frequency shift generated by the four small scatterers within the four OV parts. As the rotating axis is set to different orientations around the spot center, the frequency shift will change correspondingly. For each quadrant, the RDE frequency shifts generated under the illumination of the four parts are different, which shows a strong dependence on the orientation of the rotating axis. Taking the condition that the rotating axis is in quadrant I () as an example, the corresponding frequency shift generated by part C is the maximum while part A is the minimum, and the frequency shifts introduced by part B and part C are in the middle. The same goes for the other quadrants. Therefore, we can discriminate four orientations of the rotating axis by comparing the values of the frequency shifts introduced by the four OV parts. This is the principle of our method to distinguish the orientation of the rotating axis.
Figure 2.Simulated results of the RDE frequency shifts generated by the four parts A, B, C, and D of the OV, where the horizontal direction expresses the orientation of the rotating axis, and the vertical direction denotes the RDE frequency shift. It is clear that when the rotating axis is in the different quadrants of the CS, the magnitudes of the frequency shift caused by the four parts are different.
In order to realize the discrimination of the orientations of the rotating axis, a proof-of-concept experiment is designed and conducted. As shown in Fig. 3, a spatial light modulator (SLM) is employed to generate the desired circular asymmetry OV light field. Thanks to the powerful phase modulation ability of the SLM, we can generate the quarter OV field by designing the holograms on the SLM directly. The incomplete light field can be generated by adding physical occlusion in the optical path. To generate a high-quality OV, the complex amplitude modulation method is used here. Both the phase distribution and the amplitude information of OV beams are considered in the preparation of the holograms. The holograms are shown on the left of Fig. 3, where the colors vary from blue to red, denoting the phase distribution from 0 to ; the color varies from black to white, representing the amplitude of the OV field from the weakest to the strongest.
Figure 3.Experimental setup. The laser source generates the laser with wavelength of 532 nm. Ex, beam expander; SLM, spatial light modulator; L, lens; Ap, aperture; BS, beam splitter; APD, avalanche photodetector. The holograms uploaded on the SLM are shown in the left of the diagram. DAC is the data acquisition card. A computer plays the role of the control center, which can adjust the hologram on the SLM and the rotation of the rotor, as well as its position change along the and directions.
The entire experimental setup is shown in Fig. 3. Light beam in Gaussian mode directly illuminates the hologram on the screen of the SLM. Affected by the grating phase, the reflected light from the SLM in the first order is the desired asymmetry OV, which will next be selected by a spatial light filter. After being expanded and collimated, the probe light vertically irradiates the surface of the rotating object. As long as the surface of the object is not absolutely smooth (like a mirror), the echo light will be frequency-shifted according to the noncoaxial RDE. Then the echo light is captured by a lens and converged to the PD. The propagation direction of the OV beam is fixed, while the position of the rotor can be adjusted in the plane perpendicular to the beam axis. To increase the intensity of the echo signal, the surface of the rotating desk is covered by metallic material.
Here, the superposition mode OV is employed as the probe beam. One of the biggest advantages of the superposition state OV chosen in Lavery’s pioneering research was that the superposition state OV beam has self-interference characteristics that can omit the reference light branch [17]. Further, as explained in our previous research, the linear Doppler effect will arise when the light is at oblique incidence. However, by the implementation of the superposition state OV mode, the linear Dopper frequency shift will be counteracted after the beat frequency effect, and only the RDE frequency shift is left [31]. The beat frequency introduced by the conjugate components of the superposed OV can be expressed by , where the RDE frequency shifts generated by the two components are equal in size and opposite in sign. In the theoretical analysis, we just need to analyze the RDE frequency shift produced by one single component.
We divide the whole OV field whose topological charge is into four parts: A, B, C, and D, corresponding to the four quadrants Q-I, Q-II, Q-III, and Q-IV in the CS. The rotating object is set about 300 mm away from the beam source. Note that the practical distribution of the RDE frequency signal is affected by the scattering characteristics of the object [17], the mode purity of the probe OV beam [36], the small vibration of the object [37], and the noise signals generated by acquisition circuit. Thus, it is hard to measure the RDE frequency shift precisely as the theoretical prediction. Otherwise, we can realize the orientation recognition as accurate as 1 deg. In our proof-of-concept experiment, the goal is to determine in which quadrant of the CS the object’s axis of rotation lies.
We first arrange the rotating center in the Q-II of the CS. The misalignment between the CS origin and the rotating center is larger than the beam radius. The object rotates clockwise at a rotation speed of 27 r/s. Figures 4(a)–4(d) exhibit the four incomplete circular asymmetry OV fields on the surface of the object. The four parts of the OV field (A, B, C, and D) illuminate the object one by one. Meanwhile, the PD receives the scattered light and uploads the converted electrical signal to the computer for data processing. The magnitude of the frequency shift is different for each measurement, as shown in Figs. 4(e)–4(h). Note that the real frequency shift signals are discrete. After being smoothly filtered, the frequency peak can be identified as the final frequency shift signal. (The detailed data-processing method can be found in Appendix A.) From the results, it can be seen that the signal strength is strong for frequencies less than 1 kHz. On one hand, the vibration of the rotor and the scattering inhomogeneity due to rotation may cause low-frequency harmonics. On the other hand, although it may generate some negative frequency shift according to the noncoaxial RDE, the real frequency shift is obtained through the beam frequency phenomenon between the two conjugate modes. The negative RDE frequency shift is mainly concentrated in the positive low-frequency domain, such that the amplitudes of the frequency signals in the low-frequency area are relatively strong.
Figure 4.Experimentally observed RDE under illumination of a quarter of light field. (a)–(d) The four partial circular asymmetry OV fields relative to the rotating center; (e)–(h) the corresponding RDE frequency shift introduced by the four parts.
It can be seen from the results that the largest frequency shift occurs when part D of the OV is used for detection, while the frequency shift has the smallest value, and frequency shifts introduced by part A and part C are in the middle. The experimental results give the magnitude relationship of the frequency shift generated by the four parts as . Combined with the simulated results of Fig. 4, it can be determined that the rotating axis is in the Q-II of CS, i.e., in the northeast direction relative to the OV spot center. The experimental detection result is the same as the actual setting position of the rotating axis.
To further verify the measurement capability of the method, the second set of experiments are performed on the condition that the rotating center is on axis of the CS. The rotating speed and the topological charge are unchanged. The circular asymmetry OV beams illuminate the rotating object one by one; the corresponding frequency signal distributions are shown in Figs. 5(a)–5(d). The RDE frequency shifts generated by parts A and D have the same magnitude, while the frequency shift signals under the illumination of B and C are equal and both smaller than the RDE frequency shifts generated by A and D. The relationship between the magnitude of the frequency shifts produced by the four components is . Therefore, according to the simulation results, it is easy to know that the rotating axis is in the axis direction of the CS, i.e., the west orientation of the spot center. The corresponding result is in good agreement with the theoretical analysis.
Figure 5.(a)–(d) Experiment results under the illumination of the rotating center on one axis of the spot center-based CS. It is clear that the frequency shift generated by OV fields B and C is the same and smaller than the frequency shift generated by A and D. (e) Measurement results in eight orientations in the CS. By comparing the frequency shift introduced by the four parts, the orientation of the rotating axis relative to the OV center can be obtained according to the theoretical principle.
Although the above experimental result seems precise (which confirms the position of the rotating axis in the -axis direction and is coincident with the set position), there still exists some obscurity in the measurement process. The RDE signal frequency spectrum broadens widely as the rotating axis leaves far away from the center of the OV field. Since the total energy of the echo light is limited, the wider the frequency spectrum of the signals, the lower the magnitude will be. We obtain the frequency peak through the smooth filter with the window length of 100, combined with the frequency resolution of 3 Hz of the sampling process. The total error introduced by the measurement process is . With the beam radius on the rotating surface being and the misalignment distance of , combined with Eq. (6), the above frequency error will cause an orientation discriminating error of . Note that the orientation discriminating error is not a constant. Once the preconditions like beam radius, topological charge, rotational speed, and other parameters are changed, the relative orientation discriminating errors will change accordingly.
We further performed several controlled experiments to verify the effectiveness of the proposed method. The experimental results are shown in Fig. 5(e). Whatever the orientation of the rotating axis is, the orientation can be discriminated within a certain error range through four time measurements. We set the rotor in different orientations around the OV spot center with the same misalignment distance. The corresponding experimental results are in good agreement with the theoretical analysis. Our approach may find applications in experimental and industrial fabrication and processing settings, where alignment involving rotating surfaces is critical.
4. DISCUSSIONS AND CONCLUSIONS
Circular symmetry breaking and its influence. The key innovation of our technique is the breaking of the circular symmetry of the OV, which gives a reference direction to identify the orientation of the rotating axis. However, the Poynting vector of the OV beam is not coincident with the propagation direction of the light. Therefore, we can observe the energy flow phenomenon in a spiral path along with the Poynting vector direction, and this phenomenon can be used to directly measure the skew angle of the Poynting vector in an OV light field [35]. However, this energy flow may cause the problem in the rotating axis measurement process. Since the rotation angle of the incomplete OV field is proportional to the propagation distance, the rotating object cannot be too far from the OV source. However, thanks to the conjugate property of the superposition light, the flow direction of the two components of the superposed OV is opposite. Therefore, after a short propagation distance, the center area of the superposed OV field is not affected, as shown in Fig. 6. Even so, the detection distance should be no more than 500 mm, because the beam energy flow angle is small within this distance, and to a certain extent the measurement precision of our scheme can be guaranteed.
Figure 6.Energy flow of the single and superposed mode incomplete OV. (a) and (c) are the light field in the initial plane. (b) and (d) are the light field after the propagation distance of 4 m. It can be seen that the superposed OV is affected less significantly than the single mode by the energy flow.
Detection resolution of our approach. We divide the whole OV field into four parts and can realize the azimuth resolution of the rotating axis in four directions, i.e., in four quadrants of the CS. From Eq. (6), there are three unknowns in a practical noncooperative measurement: the misaligned distance , the rotation speed of the object, and the orientation () of the rotating axis. Therefore, at least three independent measurements are required with different OV parts to obtain the orientation of the rotating axis. In our experiments, we conduct four measurements with different OV parts to guarantee the correctness of the results. In practical measurement, we cannot obtain the RDE frequency shift only by a small scatterer. In our scheme, we divide the whole OV field into four parts; therefore, the small scatterers are distributed in the area of (). That is why we can only realize the discrimination of the orientation of the axis in the general azimuth range but cannot be as accurate as 1 deg. In theory, people can realize a higher azimuth resolution by dividing the OV field into more parts. However, limited by the technique of the optical signal acquisition, the more the parts of the light field are divided, the lower the strength of the echo signals, which may make orientation recognition difficult.
In summary, we report a new method that, based on the noncoaxial RDE and the circular symmetry broken OV beam, can realize the sensing of the rotating axis orientation. Theoretically, we proposed the basic principle of the noncoaxial RDE in the OV-centered frame and analyzed the mechanism to distinguish the orientation of the rotating center of the plane surface. Experimentally, we designed and performed the proof-of-concept experiment that verified the effectiveness of the method. In the measurement process, the four incomplete OV fields illuminate the rotating body one by one, and the echo light is collected and processed. Through the comparison of the magnitude of the frequency shift signals, the orientation of the rotating axis can be directly recognized with high accuracy and repeatability. We also discussed the factors that affect the ability to distinguish resolution and forecast the way to further increase the resolution of our approach. This technique can be used in noncooperative conditions without preknowledge of rotational speed and misalignment distance information. We have achieved for the first time the detection of the rotating axis orientation based on the OV beam. This scheme may have promising applications in the industrial manufacturing area.
APPENDIX A: DATA PROCESSING METHOD
In the measurement process, what we can directly obtain is the intensity information recorded by the PD. After the photoelectric conversion, the variation of the intensity of the echo light with time can be observed. As is shown in Fig. 7(a), the time-domain data are acquired under the detection of a quarter light field noncoaxial illumination, and the object rotational speed is 27 r/s. It can be seen that the periodic fluctuation of the time-domain echo light intensity signal is very intense. Most of the fluctuation is caused by the object rotation motion and the microvibration of the rotor whose frequency is mainly distributed in the low frequency domain. The second step is to convert time-domain data to the frequency domain through Fourier transformation. As shown in Fig. 7(b), the frequency signals are composed of the noise and the RDE frequency shift. To avoid the impact of the noise signals, the fixed frequency noise must be dislodged.
Figure 7.Data processing process. (a) Echo data in the time domain; (b) signals in the frequency domain; (c) result after the notch filter, which can eliminate the circuit noise frequency of 120 Hz and its harmonics; (d) frequency peak after the smooth filter with step size of 100.
Here, a notch filter is suitable to remove these noises. The result after the notch filter is shown in Fig. 7(c). Although the fixed noise signals are removed effectively, the frequency caused by the object rotation and the microvariation still exists and cannot be removed. However, the effect of the frequency signals in the low-frequency domain is limited, which does not affect the observation of the RDE signals. Then, we conduct the final data-processing procedure. A smooth algorithm is employed here to make the frequency signal easier to identify. The smooth filter can be expressed by where is the length of the window. After smoothly filtered, the final signal frequency is shown in Fig. 7(d).