• Acta Physica Sinica
  • Vol. 69, Issue 3, 035204-1 (2020)
En-Hao Zhang1, Hong-Bo Cai2、3、*, Bao Du2, Jian-Min Tian1, Wen-Shuai Zhang2, Dong-Guo Kang2, and Shao-Ping Zhu1、2、4、*
Author Affiliations
  • 1Graduate School, China Academy of Engineering Physics, Beijing 100088, China
  • 2Institute of Applied Physics and Computational Mathematics, Beijing 100094, China
  • 3Center for Applied Physics and Technology, Peking University, Beijing 100871, China
  • 4Science and Technology on Plasma Physics Laboratory, Laser Fusion Research Center, China Academy of Engineering Physics, Mianyang 621900, China
  • show less
    DOI: 10.7498/aps.69.20191423 Cite this Article
    En-Hao Zhang, Hong-Bo Cai, Bao Du, Jian-Min Tian, Wen-Shuai Zhang, Dong-Guo Kang, Shao-Ping Zhu. Heat flow of laser-ablated gold plasma in inertial confinement fusion hohlraum[J]. Acta Physica Sinica, 2020, 69(3): 035204-1 Copy Citation Text show less
    Electron distribution function (dotted lines) from PIC simulation in comparison with a Maxwell equilibrium distribution (dashed and dotted lines) and a super-Gaussian distribution (solid lines). The low-energy electron distribution from PIC simulation is well fitted to the super-Gaussian distribution. PIC simulation shows that the number of energetic electrons () is more than that from Maxwell equilibrium distribution, but less than that from super-Gaussian distribution. These energetic electrons play an important role in electron heat flux.电子的能量分布函数(PIC统计的电子分布函数严重偏离了同一个温度对应的麦克斯韦平衡分布, 而在低能段与相应的超高斯分布非常符合, 其中处Te = 1.53 keV, α = 1.49, m = 3.34; 处Te = 2.52 keV, α = 0.66, m = 2.93; 在高能段, 电子分布函数介于麦克斯韦分布和超高斯分布之间, 这部分电子对热流贡献最大)
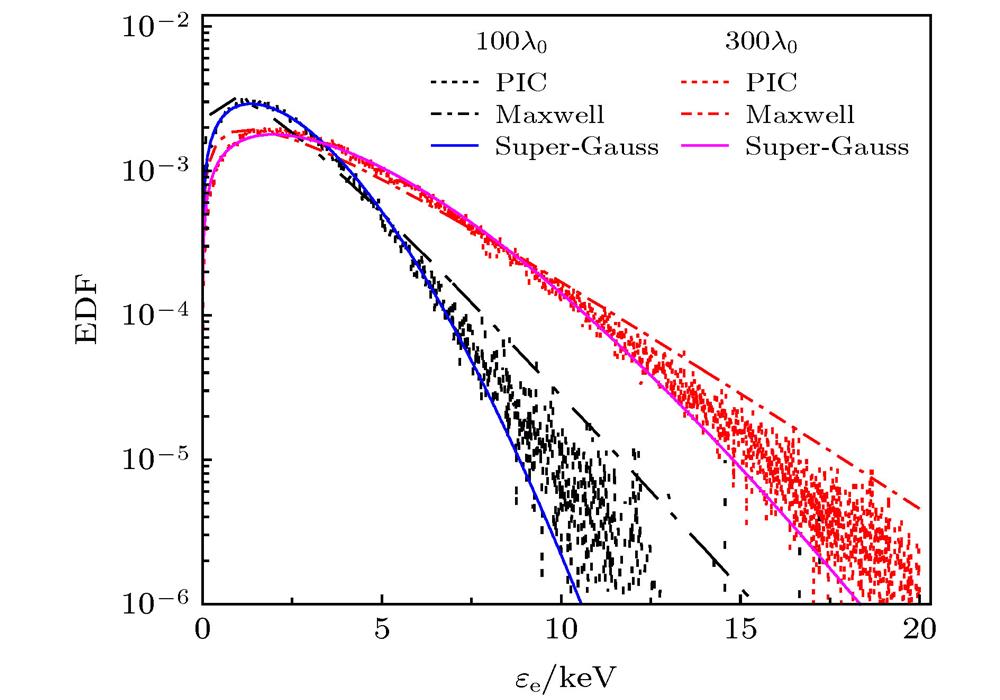
    Fig. 1. Electron distribution function (dotted lines) from PIC simulation in comparison with a Maxwell equilibrium distribution (dashed and dotted lines) and a super-Gaussian distribution (solid lines). The low-energy electron distribution from PIC simulation is well fitted to the super-Gaussian distribution. PIC simulation shows that the number of energetic electrons ( ) is more than that from Maxwell equilibrium distribution, but less than that from super-Gaussian distribution. These energetic electrons play an important role in electron heat flux. 电子的能量分布函数(PIC统计的电子分布函数严重偏离了同一个温度对应的麦克斯韦平衡分布, 而在低能段与相应的超高斯分布非常符合, 其中 处Te = 1.53 keV, α = 1.49, m = 3.34; 处Te = 2.52 keV, α = 0.66, m = 2.93; 在高能段, 电子分布函数介于麦克斯韦分布和超高斯分布之间, 这部分电子对热流贡献最大)
    Electron heat flux (black line) from PIC simulation in comparison with that from flux-limited S-H model for . The unit of the electron heat flux is the electron free stream Qfs0 (1nc, 1 keV) = 1.936 × 10¹⁹ J/(cm2·s). In the high density region, the electron heat flux from the limited S-H agrees well with PIC simulation result. But in the coronal region, the electron heat flux from the flux-limited S-H is much larger than that from PIC simulation.等离子体中的电子热流(热流以对应的电子自由流为单位; 限流的S-H电子热流无法解释等离子体冕区存在的热流受限现象, 而与高密度区域的电子热流比较符合; 但电子热流严重依赖于限流因子, 需要根据不同位置的光强和电子温度调整的大小)
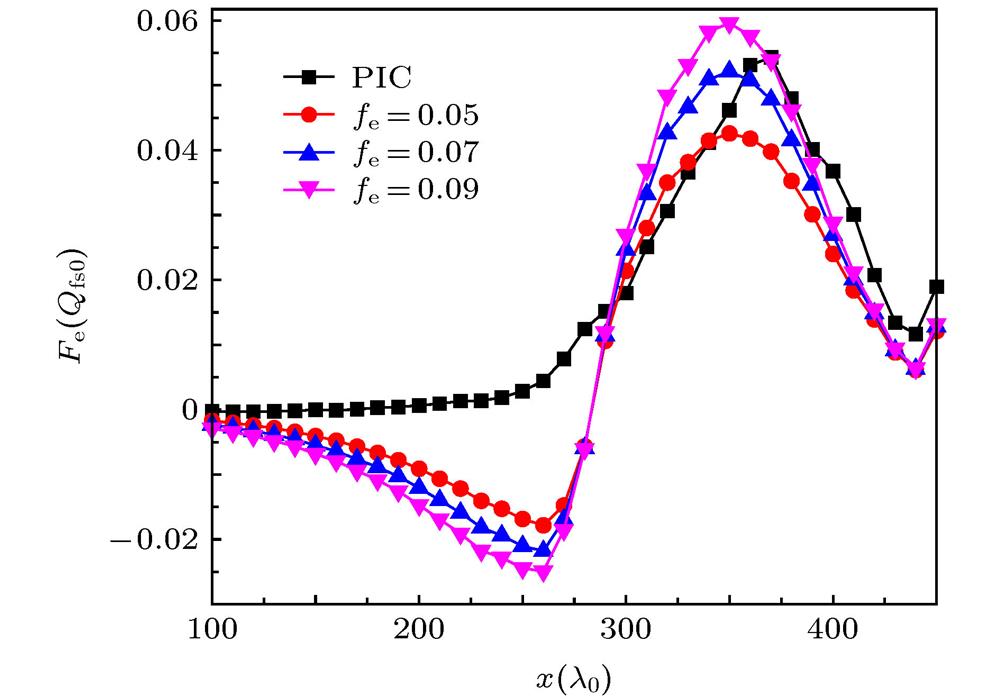
    Fig. 2. Electron heat flux (black line) from PIC simulation in comparison with that from flux-limited S-H model for . The unit of the electron heat flux is the electron free stream Qfs0 (1nc, 1 keV) = 1.936 × 10¹⁹ J/(cm2·s). In the high density region, the electron heat flux from the limited S-H agrees well with PIC simulation result. But in the coronal region, the electron heat flux from the flux-limited S-H is much larger than that from PIC simulation. 等离子体中的电子热流 (热流以 对应的电子自由流 为单位; 限流的S-H电子热流无法解释等离子体冕区存在的热流受限现象, 而与高密度区域的电子热流比较符合; 但电子热流严重依赖于限流因子 , 需要根据不同位置的光强和电子温度调整 的大小)
    Electron temperature from PIC simulation (solid lines) in comparison with that from radiation hydrodynamic simulation RDMG (dashed lines) and that from the optical path tracking model without heat flux (dashed and dotted lines). In the coronal region, the limited-flux S-H predicts too large electron heat flux and results in too high electron temperature from RDMG.电子温度的空间分布(上方三条粗线对应, 下方三条细线对应, 蓝色点线Theory表示无热流的光路追踪理论模型; 等离子体冕区温度梯度大, 克努森数超过临界值, 限流的局域S-H电子热流无法准确描述电子热流, 造成了RDMG对冕区电子热流的高估, 从而高估了电子温度; 高密度部分区域由于实际IBA系数低于理论值, 导致RDMG和无热流光路追踪模型估计的电子温度高于PIC结果)
    Fig. 3. Electron temperature from PIC simulation (solid lines) in comparison with that from radiation hydrodynamic simulation RDMG (dashed lines) and that from the optical path tracking model without heat flux (dashed and dotted lines). In the coronal region, the limited-flux S-H predicts too large electron heat flux and results in too high electron temperature from RDMG.电子温度的空间分布(上方三条粗线对应 , 下方三条细线对应 , 蓝色点线Theory表示无热流的光路追踪理论模型; 等离子体冕区温度梯度大, 克努森数超过临界值, 限流的局域S-H电子热流无法准确描述电子热流, 造成了RDMG对冕区电子热流的高估, 从而高估了电子温度; 高密度部分区域由于实际IBA系数低于理论值, 导致RDMG和无热流光路追踪模型估计的电子温度高于PIC结果)
    Decay curves of laser intensity from PIC simulation (solid lines) in comparison with that from radiation hydrodynamics simulation RDMG (dashed lines) and that from the optical path tracking model without heat flux (dashed and dotted lines). In the high density region, the inverse Bremsstraws absorption coefficient is smaller than the classical expression , so the laser intensity from PIC simulation is higher than that from RDMG and the optical path tracking model.等离子体中的光强衰减图(上方三条粗线对应, 下方三条细线对应, 蓝色点线Theory表示无热流的光路追踪理论模型; 由于高密度区域实际IBA系数低于理论值, 导致RDMG和无热流光路追踪模型高估了能量沉积, 激光衰减更快而无法到达临界面)
    Fig. 4. Decay curves of laser intensity from PIC simulation (solid lines) in comparison with that from radiation hydrodynamics simulation RDMG (dashed lines) and that from the optical path tracking model without heat flux (dashed and dotted lines). In the high density region, the inverse Bremsstraws absorption coefficient is smaller than the classical expression , so the laser intensity from PIC simulation is higher than that from RDMG and the optical path tracking model. 等离子体中的光强衰减图(上方三条粗线对应 , 下方三条细线对应 , 蓝色点线Theory表示无热流的光路追踪理论模型; 由于高密度区域实际IBA系数低于理论值, 导致RDMG和无热流光路追踪模型高估了能量沉积, 激光衰减更快而无法到达临界面)
    En-Hao Zhang, Hong-Bo Cai, Bao Du, Jian-Min Tian, Wen-Shuai Zhang, Dong-Guo Kang, Shao-Ping Zhu. Heat flow of laser-ablated gold plasma in inertial confinement fusion hohlraum[J]. Acta Physica Sinica, 2020, 69(3): 035204-1
    Download Citation