• Journal of Resources and Ecology
  • Vol. 11, Issue 6, 598 (2020)
Shiyin CHEN and Zhiyu MA*
Author Affiliations
  • Management College of Guangdong Ocean University, Zhanjiang, Guangdong 524088, China
  • show less
    DOI: 10.5814/j.issn.1674-764x.2020.06.007 Cite this Article
    Shiyin CHEN, Zhiyu MA. Temporal and Spatial Characteristics and Optimization of the Intensive Use of Cultivated Land in Maoming City[J]. Journal of Resources and Ecology, 2020, 11(6): 598 Copy Citation Text show less
    Location map of Maoming City
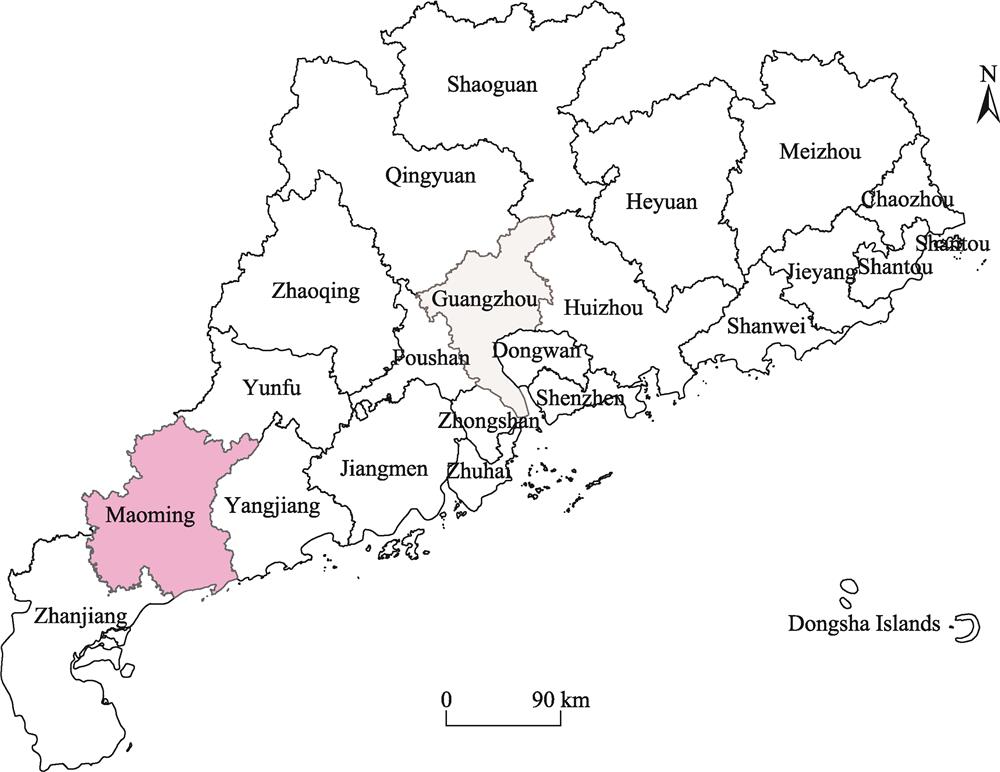
    Fig. 1. Location map of Maoming City
    Spatial changes of cultivated land intensity in Maoming City in 2007, 2010, 2013 and 2017
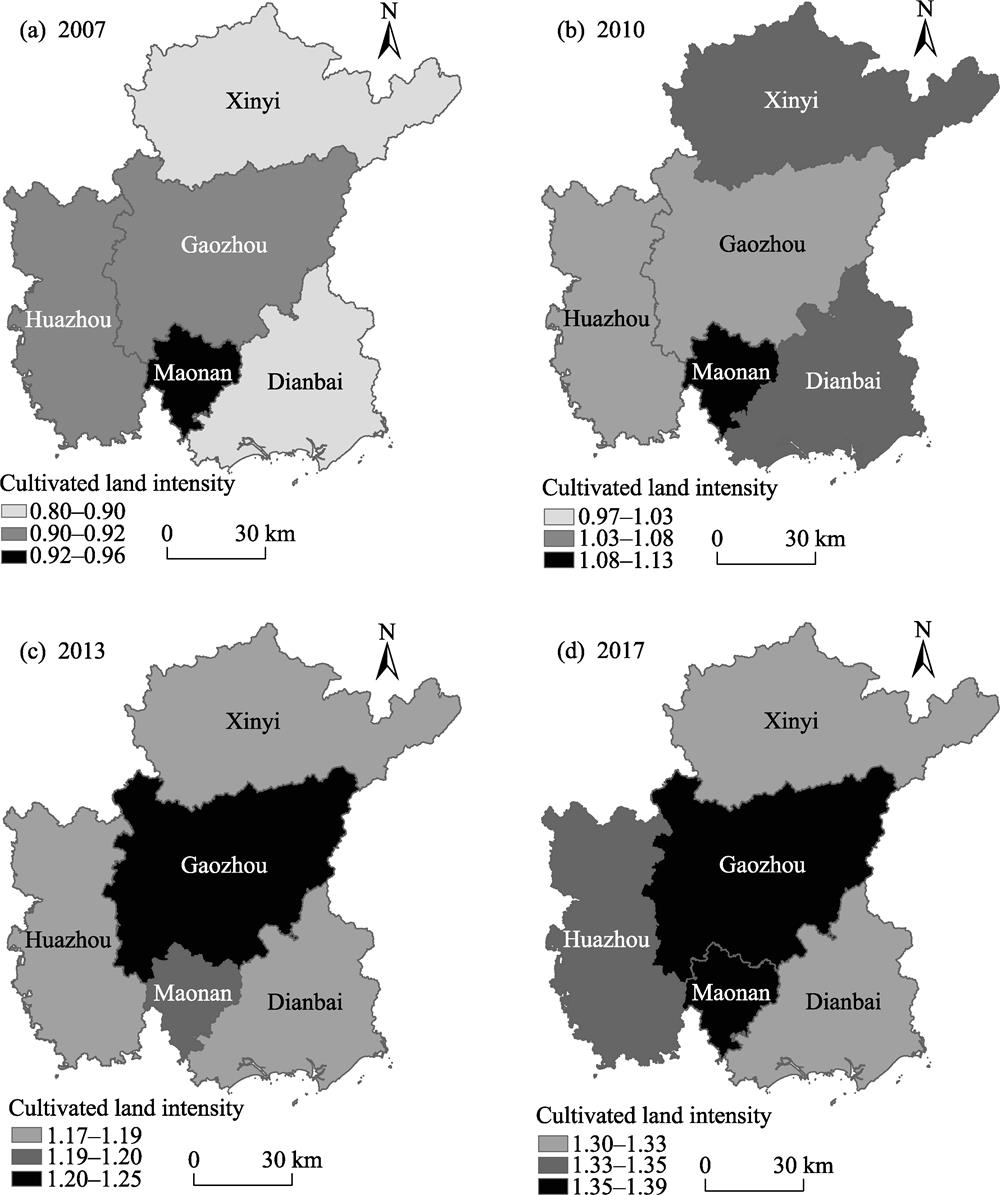
    Fig. 2. Spatial changes of cultivated land intensity in Maoming City in 2007, 2010, 2013 and 2017
    Major types
    Paddy fieldIrrigated landDryland
    Maoming2002141001349553484830411
    Huazhou5062025.33422564319946
    Dianbai5266526.333068823410823
    Gaozhou4758223.73487756347071
    Xinyi3241616.22166561347071
    Maonan169318.51112034202391
    Table 1.

    Cultivated land spatial distribution of Maoming City in 2017(unit: ha)

    Target layerCriterion layerIndex layerWeight
    Intensive use of cultivated land (A)Cultivated land use intensity (B1)Fertilizer input per unit area (C11)0.7112
    Labor input per unit area (C12)0.0790
    Mechanical input per unit area (C13)0.2098
    Cultivated land use degree (B2)Cropland multiple cropping index (C21)0.1661
    Farmland irrigation index (C22)0.2565
    Input of farmland plastic film (C23)0.1247
    Cultivated land use output benefit (B3)Per unit area yield (C31)0.4527
    Yield safety factor (C32)0.1423
    Average output value per worker (C33)0.5737
    Sustainable use of cultivated land (B4)Forest coverage (C41)0.2840
    Per capita arable land (C42)0.3457
    Non-agricultural index (C43)0.6543
    Table 2.

    Cultivated land intensive use index evaluation system

    Order123456789
    RI000.580.91.121.241.321.411.45
    Table 3.

    The average random consistency index RI

    YearIntensityDegreeOutput effectSustainable statusIntensive use of cultivated land
    20040.06140.10830.02140.21340.4045
    20050.09910.23240.02340.32130.6762
    20060.02210.22780.03540.32340.6087
    20070.03210.06450.01370.10910.2194
    20080.04230.09840.05340.23140.4255
    20090.07120.11260.08370.28670.5542
    20100.11180.11430.11430.36420.7046
    20110.13770.15130.14210.48590.917
    20120.17120.25420.16310.66431.2528
    20130.12580.08720.17430.42310.8104
    20140.17870.14520.22270.51211.0587
    20150.20180.14230.23560.53451.1142
    20160.2560.11460.25390.62311.2476
    20170.26220.14310.27410.63541.3148
    Table 4.

    Index of cultivated land intensive use of Maoming in 2004-2017

    City/District2007201020132017
    Huazhou0.92451.03401.16691.3452
    Gaozhou0.92360.97271.25051.3698
    Xinyi0.89921.06681.18371.3326
    Dianbai0.88481.08051.18651.3029
    Maonan0.95931.13301.19871.3928
    Table 5.

    Cultivated land intensive use degree of cities/districts in Maoming in 2007, 2010, 2013, and 2017

    Shiyin CHEN, Zhiyu MA. Temporal and Spatial Characteristics and Optimization of the Intensive Use of Cultivated Land in Maoming City[J]. Journal of Resources and Ecology, 2020, 11(6): 598
    Download Citation