
Mingyi Ma, Liang Cui, Xiaoying Li. Engineering the spectral profile of photon pairs by using multi-stage nonlinear interferometers[J]. Chinese Optics Letters, 2021, 19(5): 052702
- Chinese Optics Letters
- Vol. 19, Issue 5, 052702 (2021)
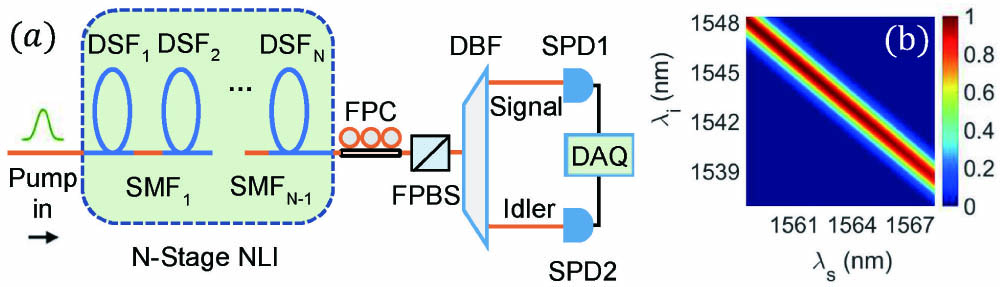
Fig. 1. (a) Experimental setup of generating photon pairs from an N-stage nonlinear interferometer (NLI) consisting of N pieces of nonlinear media of dispersion shifted fibers (DSFs) and N−1 pieces of phase shifters of standard single mode fibers (SMFs). DBF, dual-band filter; FPC, fiber polarization controller; FPBS, fiber polarization beam splitter; SPD, single photon detector; DAQ, data acquisition system. (b) The contour of JSI
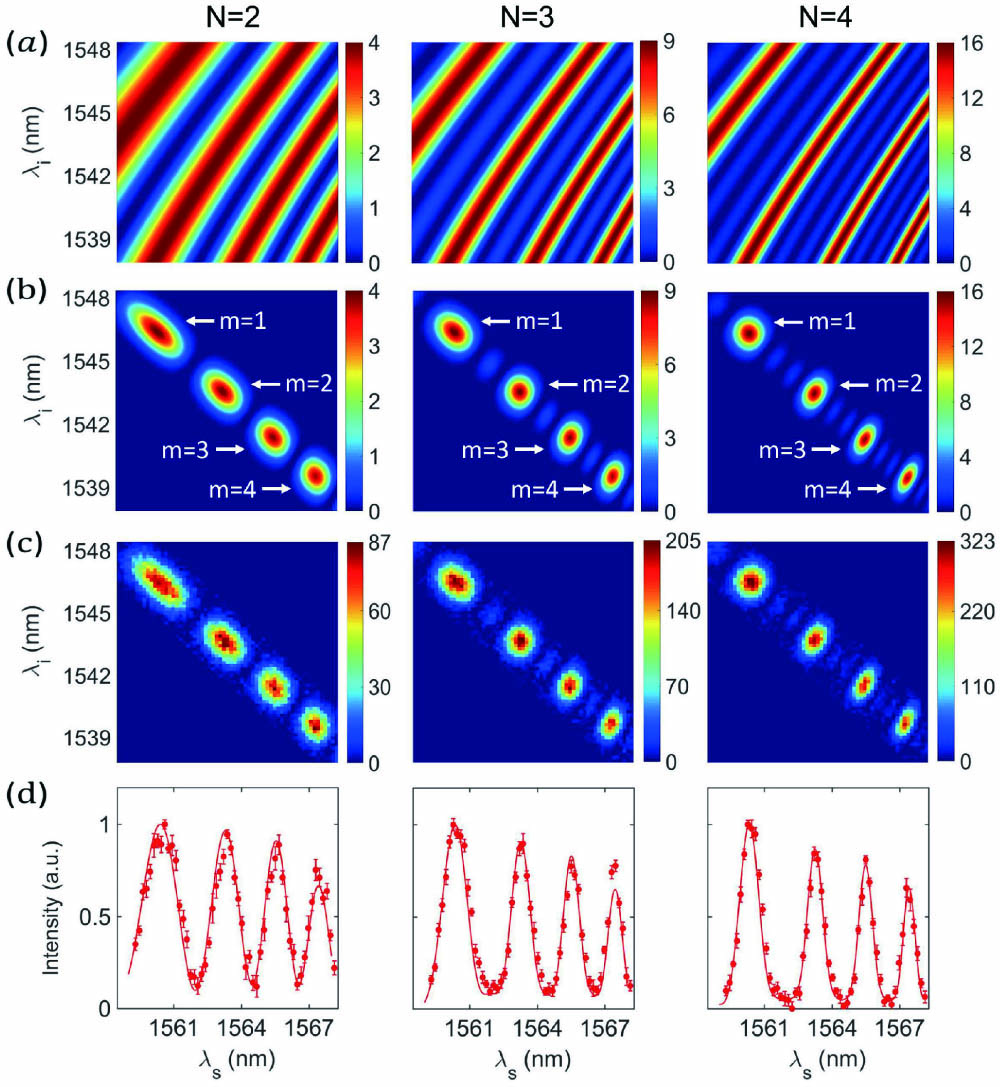
Fig. 2. Results for N-stage NLI with N = 2, 3, 4 when the lengths of each DSF and SMF in the NLI are 100 m and 10 m, respectively. (a), (b) The contours of interference factor 2 ) and (1 ), respectively. (c) Contour maps of measured true coincidence of photon pairs, which reflect the JSI of photon pairs. (d) Measured (dots) and calculated (solid curves) marginal intensity distributions of signal photons.
Fig. 3. Measured counting rate (dots) Rs as a function of the average pump power Pa for the photons in an individual signal band centering at (a) 1560.4 nm and (b) 1561.9 nm, respectively. The solid curve
Fig. 4. Results for uneven N-stage NLI, in which the lengths of DSFs, labelled in the top for different stage number N, follow binomial distribution. (a), (b) The calculated contours of interference factor 5 ) and (6 )], respectively. (c) Contour maps of true coincidence of photon pairs, reflecting the JSI of photon pairs. (d) Measured (dots) and calculated (solid curves) marginal intensity distributions of signal photons.

Set citation alerts for the article
Please enter your email address
© Copyright 2018-2021 | Chinese Laser Press. All Rights Reserved 沪ICP备15018463号-20