• Advanced Photonics
  • Vol. 5, Issue 1, 015001 (2023)
Yijie Shen1、*, Bingshi Yu2, Haijun Wu2, Chunyu Li2, Zhihan Zhu2、*, and Anatoly V. Zayats3、*
Author Affiliations
  • 1University of Southampton, Optoelectronics Research Centre and Centre for Photonic Metamaterials, Southampton, United Kingdom
  • 2Harbin University of Science and Technology, Wang Da-Heng Center, Heilongjiang Key Laboratory of Quantum Control, Harbin, China
  • 3King’s College London, London Centre for Nanotechnology, Department of Physics, London, United Kingdom
  • show less
    DOI: 10.1117/1.AP.5.1.015001 Cite this Article Set citation alerts
    Yijie Shen, Bingshi Yu, Haijun Wu, Chunyu Li, Zhihan Zhu, Anatoly V. Zayats. Topological transformation and free-space transport of photonic hopfions[J]. Advanced Photonics, 2023, 5(1): 015001 Copy Citation Text show less
    (a) The parameter-space visualization of a hypersphere: the longitude and latitude degrees (α and β) of a parametric 2-sphere are represented by hue color and its lightness (dark towards the south pole, where spin is down, and bright towards the north pole, where spin is up). Each point on a parametric 2-sphere corresponds to a closed isospin line located in a 3D Euclidean space. (b) The lines projected from the selected points of the same latitude β and different longitude α on the hypersphere (highlighted by the solid dots with the corresponding hue colors) form torus knots covering a torus (with different tori corresponding to different β). (c) The real-space visualization of a Hopf fibration as a full stereographic mapping from a hypersphere: toroidally knotted lines (torus knots) arranged on a set of coaxially nested tori, with each torus corresponding to different latitude β of a parametric 2-sphere. The black circle corresponds to the south pole (spin down) and the axis of the nested tori corresponds to the north pole (spin up) in (a). (d) The 3D spin distribution in a hopfion, corresponding to the isospin contours in panel (c), with each spin vector colored by its α and β parameters of a parametric sphere in panel (a), as shown in the inset. (e), (f) The cross-sectional view of the spin distribution in panel (d): (e) x–y (z=0) and (f) y–z (x=0) cross sections show skyrmion-like structures with the gray arrows marking the vorticity of the skyrmions. Color scale corresponds to the spin direction in panel (d).
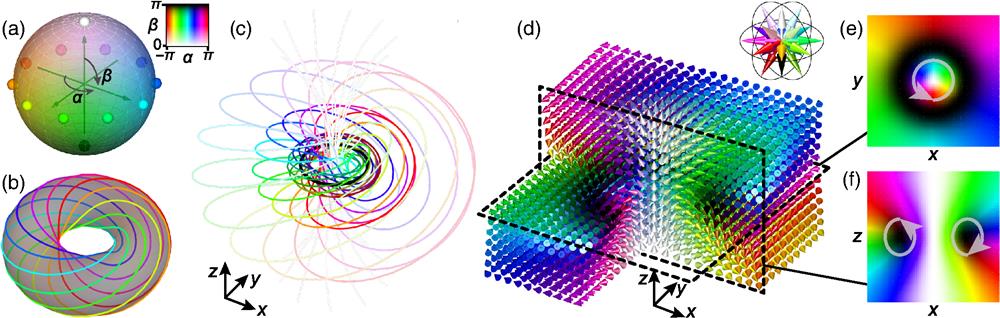
    Fig. 1. (a) The parameter-space visualization of a hypersphere: the longitude and latitude degrees (α and β) of a parametric 2-sphere are represented by hue color and its lightness (dark towards the south pole, where spin is down, and bright towards the north pole, where spin is up). Each point on a parametric 2-sphere corresponds to a closed isospin line located in a 3D Euclidean space. (b) The lines projected from the selected points of the same latitude β and different longitude α on the hypersphere (highlighted by the solid dots with the corresponding hue colors) form torus knots covering a torus (with different tori corresponding to different β). (c) The real-space visualization of a Hopf fibration as a full stereographic mapping from a hypersphere: toroidally knotted lines (torus knots) arranged on a set of coaxially nested tori, with each torus corresponding to different latitude β of a parametric 2-sphere. The black circle corresponds to the south pole (spin down) and the axis of the nested tori corresponds to the north pole (spin up) in (a). (d) The 3D spin distribution in a hopfion, corresponding to the isospin contours in panel (c), with each spin vector colored by its α and β parameters of a parametric sphere in panel (a), as shown in the inset. (e), (f) The cross-sectional view of the spin distribution in panel (d): (e) xy (z=0) and (f) yz (x=0) cross sections show skyrmion-like structures with the gray arrows marking the vorticity of the skyrmions. Color scale corresponds to the spin direction in panel (d).
    Left, simulated Stokes vector distributions in the skyrmionium textures in the x–y (z=0) plane of the photonic hopfions of (a) Néel Type-I (QP=1,QV=1,θ=0), (b) Bloch type (QP=1,QV=1,θ=π/2), (c) Néel Type-II (QP=1,QV=1,θ=π), and (d) antitype (QP=1,QV=−1,θ=π). The insets in black circles highlight the corresponding texture of the x–y components. Right, theoretical and experimental polarization distributions represented by Poincaré parameters (orientation and ellipticity of the polarization ellipse) in the x–y and y–z planes for the topological hopfions in panels (a)–(d). The x and y scales are normalized to the fundamental mode waist radius w0, and the z-scale is normalized to the Rayleigh range zR. The color scale is as shown in Fig. 1.
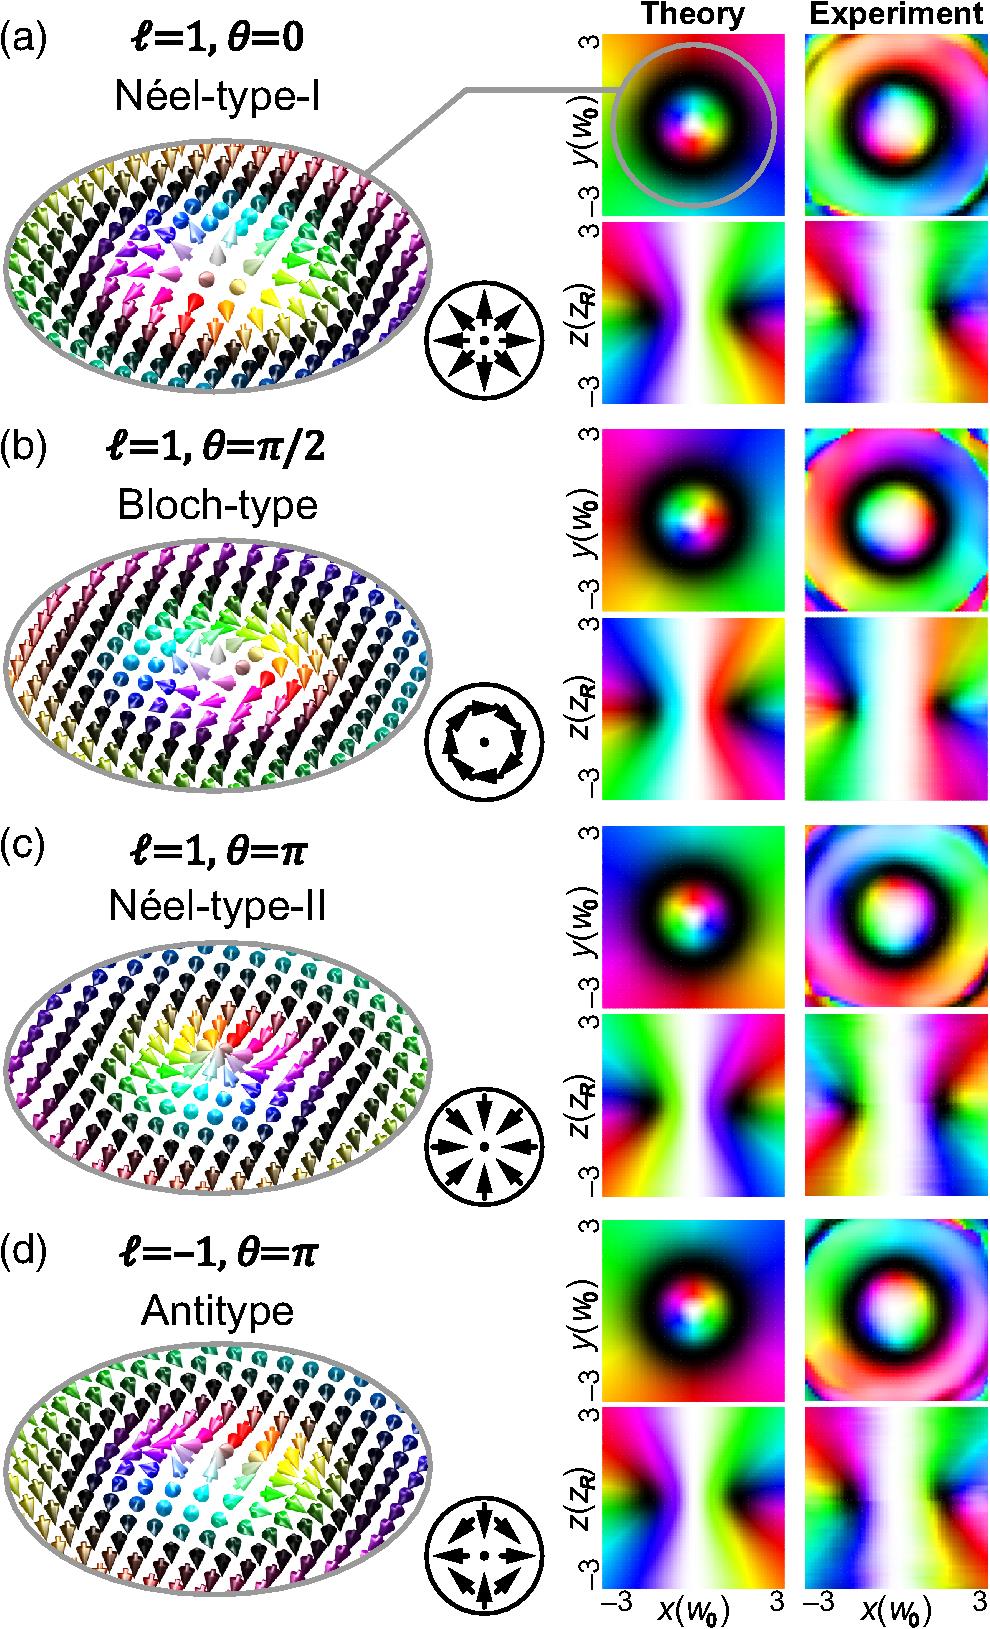
    Fig. 2. Left, simulated Stokes vector distributions in the skyrmionium textures in the xy (z=0) plane of the photonic hopfions of (a) Néel Type-I (QP=1,QV=1,θ=0), (b) Bloch type (QP=1,QV=1,θ=π/2), (c) Néel Type-II (QP=1,QV=1,θ=π), and (d) antitype (QP=1,QV=1,θ=π). The insets in black circles highlight the corresponding texture of the xy components. Right, theoretical and experimental polarization distributions represented by Poincaré parameters (orientation and ellipticity of the polarization ellipse) in the xy and yz planes for the topological hopfions in panels (a)–(d). The x and y scales are normalized to the fundamental mode waist radius w0, and the z-scale is normalized to the Rayleigh range zR. The color scale is as shown in Fig. 1.
    (Top) The torus-knot configurations of a toroidal layer in the Hopf fibration for the higher-order hopfions with Hopf indices of (a) QH=−2, (b) QH=2, and (c) QH=3. (Bottom) Theoretical and experimental polarization distributions in the x–y and y–z planes for the hopfions in panels (a)–(c). Gray arrows indicate the vorticity. The geometric scales and the color scale are as shown in Fig. 2.
    Fig. 3. (Top) The torus-knot configurations of a toroidal layer in the Hopf fibration for the higher-order hopfions with Hopf indices of (a) QH=2, (b) QH=2, and (c) QH=3. (Bottom) Theoretical and experimental polarization distributions in the xy and yz planes for the hopfions in panels (a)–(c). Gray arrows indicate the vorticity. The geometric scales and the color scale are as shown in Fig. 2.
    Propagation of photonic hopfions in free space. (Top) Theoretical and (bottom) experimental polarization distributions in the x–z plane for different phases φ from −π/2 to π/2. The hopfion torus center moves along z from z=−zR to z=zR as φ changes. The gray dashed lines mark the location of hopfion torus centers. Gray arrows indicate the vorticity. The geometric scales and the color scale are as shown in Fig. 2.
    Fig. 4. Propagation of photonic hopfions in free space. (Top) Theoretical and (bottom) experimental polarization distributions in the xz plane for different phases φ from π/2 to π/2. The hopfion torus center moves along z from z=zR to z=zR as φ changes. The gray dashed lines mark the location of hopfion torus centers. Gray arrows indicate the vorticity. The geometric scales and the color scale are as shown in Fig. 2.
    Yijie Shen, Bingshi Yu, Haijun Wu, Chunyu Li, Zhihan Zhu, Anatoly V. Zayats. Topological transformation and free-space transport of photonic hopfions[J]. Advanced Photonics, 2023, 5(1): 015001
    Download Citation