
Carlo M. Valensise, Ivana Grecco, Davide Pierangeli, Claudio Conti, "Large-scale photonic natural language processing," Photonics Res. 10, 2846 (2022)
- Photonics Research
- Vol. 10, Issue 12, 2846 (2022)
![Three-dimensional PELM for language processing. (A) The text database entry is a paragraph of variable length. Text pre-processing: a sparse representation of the input paragraph is mapped into a Hadamard matrix with phase values in [0,π]. (B) The mask is encoded into the optical wavefront by a phase-only SLM. Free-space propagation of the optical field maps the input data into a 3D intensity distribution (speckle-like volume). (C) Sampling the propagating laser beam in multiple far-field planes enables upscaling the feature space. Intensities picked from all the spatial modes form the output layer H3D that undergoes training via ridge regression. By using three planes (j=3), we get a network capacity C>1010. (D) The example shows a binary text classification problem for large-scale rating.](/richHtml/prj/2022/10/12/2846/img_001.jpg)
Fig. 1. Three-dimensional PELM for language processing. (A) The text database entry is a paragraph of variable length. Text pre-processing: a sparse representation of the input paragraph is mapped into a Hadamard matrix with phase values in [ 0 , π ] H 3 D j = 3 C > 10 10
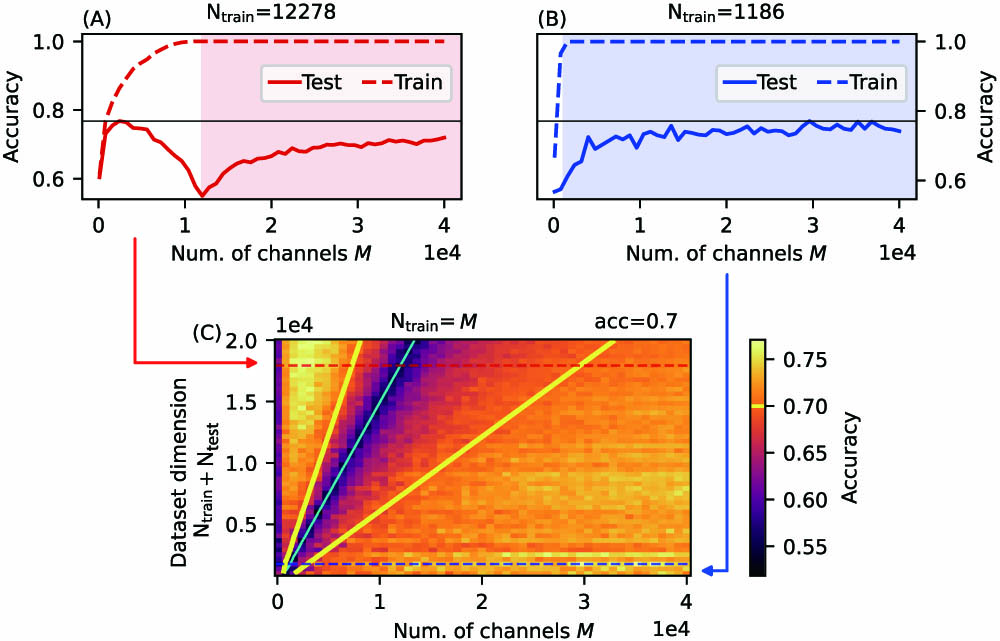
Fig. 2. Photonic sentiment analysis. (A), (B) Training and test accuracy of the 3D-PELM on the IMDb dataset as a function of the number of output channels. The shaded area corresponds to the over-parameterized region. The configuration in (B) allows us to reach very high accuracy in the over-parameterized region with a dataset limited to N train = 1186 N train = 12 , 278 M N train N train = M
Fig. 3. Performances at ultralarge scale. (A)–(C) Test accuracy as a function of M L m M = 0.8 × 10 5 M = 1.2 × 10 5
Fig. 4. Analysis of the IMDb accuracy. (A), (B) The comparison reports the accuracy for the experimental device (3D-PELM device), the simulated device (3D-PELM numerics), the random projection method with ridge regression (RP), the support vector machine (SVM), and a convolutional neural network (CNN) in both the under-parameterized (M = 1 × 10 3 M = 4 × 10 4 N train = 6700 N train = 1500
|
Table 1. Maximum Network Capacity of Current Photonic Neuromorphic Computing Hardware for Supervised Learning


Set citation alerts for the article
Please enter your email address

© Copyright 2018-2021 | Chinese Laser Press. All Rights Reserved 沪ICP备15018463号-20